*UMPSA STEM Lab Raspberry Pi Programming Synopsis can be found here.
In the Raspberry Pi IoT session, 24 UMPSA mentors were introduced to the concept of the Internet of Things (IoT) using Raspberry Pi on the UMP STEM Cube, a pico-satellite learning kit specifically designed to facilitate engineering learning.
The content covered basic digital input/output operations on onboard LEDs, as well as topics such as dashboard design using gyro meter and BMU280 sensor data, including collecting and storing data in a cloud database. Participants learned to interface sensors with Raspberry Pi boards and develop IoT applications for real-world scenarios. The session provided students with valuable insights into IoT technology and its applications in various domains.
A special appreciation is extended to En Mohd Jamil Jaafar for coordination in facilitating communication between the participants and the UMPSA STEM Lab :).
I recently attended a sharing session by Prof Hilman on research and teaching technology in Electronic Engineering, and it left a strong impression, particularly in terms of how much care and thought he puts into his teaching.
What stood out most was Prof Hilman’s creativity and long-term commitment to his classroom. Over the years, he has developed a series of learning kits that are used across different levels of the programme, from first year right up to final year. These kits are not one-size-fits-all; instead, they are modular, covering topics ranging from analog electronics and RF to sensor design. You can clearly see that they were built with progression in mind, allowing students to grow into the complexity of the subject rather than being overwhelmed by it.
Having developed teaching kits myself, mainly for mini robotics, embedded systems, and IoT, I found myself very much on the same page. Designing kits for teaching is rewarding, but it also comes with its own set of challenges, especially when it comes to deciding how much to give students and how much to leave for them to figure out on their own.
When I talk about “giving everything,” I’m referring to situations where kits / modules that are highly prepared: dedicated PCBs, predefined functional blocks, and ready-to-use modules. This certainly helps students get started more quickly and reduces frustration. At the same time, we sometimes forget that designing those things, like laying out a PCB or deciding how a circuit or functions (in software programming) should be structured, is also an important part of learning.
On the other end of the spectrum is giving students only the bare minimum and expecting them to build everything from scratch. While this can be very powerful for learning, it is not always easy to manage in a real classroom. Students learn at different speeds, and ensuring that everyone can keep up within a fixed semester timeline can be quite challenging.
This is something I’ve often thought about through the lens of the white‑box versus black‑box approach, which I also discussed in my earlier works on tiered scaffolding approaches in Python Slider Game and the STEMCube platform. Both approaches have their place, and the real question is how to strike the right balance.
During the session, I raised this question with Prof Hilman, and we had a good discussion around it. What I found particularly insightful was his view that modularity helps bridge the gap between these two extremes. By designing kits in modules, we can decide which parts are “given” and which parts students are encouraged to develop themselves. As students progress, more of the system can be opened up to them. This makes the learning process more flexible and helps accommodate different learning paces within the same class.
We also touched briefly on the role of AI in analog design, especially during the early design and optimisation stages. While still an evolving area, it sparked an interesting discussion about how such tools might eventually support both teaching and research in electronics engineering.
Overall, the session was a good reminder that effective teaching innovation doesn’t come from choosing one extreme over another, but from carefully designing learning experiences that evolve with students. Prof Hilman’s modular approach is a practical example of how this balance can be achieved, and it’s certainly something I will continue to reflect on in my own teaching practice.
Students from BTE 1522 and DRE2213 presented their final projects, and the outcomes were impressive =).
What began at the start of the course as an introduction to beginner Python programming through a simple Pygame slider game (Pygame assignments) has now evolved into fully functional sensor-based systems using Raspberry Pi and the BME280 environmental sensor.
This transition from a purely digital game environment to a real-world, physically embedded system, was intentional =).
By first grounding students in Python fundamentals (variables, loops, conditionals, event handling, and logic flow) through game development, students were able to focus later on how their code interacts with the physical world.
BTE1522 – IMU Data Collection
Learning Python Through Motion, Data, and Innovation: BTE1522 Project Showcase
Students from BTE1522 – Innovation (Python) recently presented their final projects, and the results clearly demonstrated how hands-on, sensor-driven learning can elevate Python programming skills.
In this course, students worked with the MPU6050 motion sensor on the LilEx 5 platform, moving beyond basic scripting to build end-to-end data-driven systems involving sensing, storage, and visualization.
Project Focus
Each student group was tasked to:
Read motion data from the MPU6050 using Python
Design and conduct structured data collection for different human movements
Store the data in a database of their choice
Build a dashboard to visualize and interpret the collected data
This workflow mirrors real-world IoT and data engineering pipelines.
Movement-Based Data Collection
Students collected sensor data based on well-defined criteria, including:
Standing
Leaning left and right (roll)
Bending forward and backward (pitch)
Lying down
They carefully controlled parameters such as:
Sampling rate
Timeframe per movement
Sensor placement
Calibration procedures
This encouraged students to think critically about data quality, consistency, and repeatability, not just code correctness.
From Raw Sensor Data to Insight
Using Python, students transformed raw accelerometer and gyroscope readings into structured datasets. They then explored different tools and platforms to:
Build databases
Create dashboards for visualization and interpretation
Through this process, students learned that innovation is not only about building something new, but also about making data understandable and useful.
Physical Embodiment as a Learning Strategy
Similar to DRE2213, this course emphasized learning through physical embodiment. Students could directly observe how body movement affected sensor readings, reinforcing their understanding of:
Coordinate axes
Sensor fusion concepts
Time-series data behavior
By linking physical motion to Python code and visual dashboards, abstract programming concepts became concrete and intuitive.
Overall, student performance was very satisfying. Good job everyone.
The projects demonstrated strong engagement, creativity, and a growing confidence in Python programming.
The project videos embedded below highlight how students applied Python not just as a programming language, but as a tool for sensing, data analysis, and innovation.
DRE2213 – BM280 Data Monitoring – SULAM
Project Highlights
In their final projects, DRE2213 students successfully demonstrated:
Closed-loop sensing systems Integrating the BME280 sensor with Raspberry Pi using Python, where sensor readings triggered real-time responses such as LEDs and buzzers.
Data logging and storage Students independently explored multiple database solutions:
Firebase
Google Sheets / Spreadsheet-based logging This showed strong initiative and adaptability beyond what was explicitly taught.
Dashboard development and visualization A wide range of dashboard approaches were implemented, including:
HTML-based dashboards
Adafruit IO
Flask web applications
Streamlit dashboards
Each solution reflected different design choices, yet all achieved the same goal: making sensor data meaningful, visible, and interactive.
What stood out most was how BTE1522 and DRE2213 students connected abstract Python code to tangible outcomes. Seeing a buzzer activate, an LED respond, or a dashboard update in real time helped students understand what their code is doing, not just whether it runs.
This combination of:
Digital embodiment (game-based learning with Pygame), and
Physical embodiment (real sensors, real data, real feedback)
proved to be a powerful approach in helping students grasp programming concepts more deeply and confidently.
Reflection
The quality of the projects and the variety of technical approaches exceeded expectations. Students demonstrated not only programming skills, but also problem-solving, system integration, and creativity.
The embedded project videos below showcase their work and reflect a learning journey that truly bridges Python programming and real-world applications.
Installation of Computer visual code (cvs) for advance application in image and data processing
Today students from BHE 25/26 I participated in a hands-on programming training session designed to make learning Python both engaging and intuitive. The session ran from 8:30 AM to 12:45 PM and combined game-based learning with practical tool setup for future advanced applications.
The training introduced students to core programming concepts through an interactive Slider Game, followed by the installation of Visual Studio Code (VS Code) to prepare them for more advanced work in image and data processing.
Session 1: Learning Python Basics Through the Slider Game
Time: 8:30 AM – 12:30 PM
Instead of starting with abstract syntax and long code examples, students learned Python fundamentals by building and modifying a simple Slider Game. This approach allowed concepts to emerge naturally through interaction and experimentation.
Through guided activities, students progressively explored:
Variables – storing and updating player positions, scores, and timers
Mathematical operations – controlling movement speed, scoring, and boundaries
Control structures (loops & conditionals) – managing enemy movement, collisions, and game flow
Event handling – responding to keyboard inputs for real-time player control
Data structures – using lists to manage multiple enemies and game objects
Functions – organizing code for clarity and reusability
Debugging and logical thinking – testing, observing outcomes, and refining logic
By the end of the session, students were not just reading code—they were seeing their code come alive on the screen.
Learning by Seeing and Doing: Digital & Physical Embodiment
A key strength of the Slider Game approach is embodied learning. As students interacted with the game—moving the player, triggering collisions, or adjusting timing—they could immediately visualize the effect of each programming concept.
This form of digital embodiment supports deeper understanding:
Students test hypotheses by changing values and logic
Errors become learning opportunities rather than frustrations
By observing how their code directly influences game behavior, students developed stronger intuition about how programming logic works in real systems.
Session 2: Preparing for Advanced Applications
Time: 12:30 PM – 12:45 PM
In the final segment, students were guided through the installation and setup of Visual Studio Code (VS Code)—a widely used development environment for professional and academic programming. This is as part of their preparation for their upcoming flying professor’s class in March 2026.
This step prepares students for:
Advanced Python development
Image processing and computer vision
Data analysis and visualization
Future projects involving AI and intelligent systems
Introducing VS Code early helps students transition smoothly from learning concepts to building more complex, real-world applications.
Looking Ahead
This training demonstrated that game-based and embodied learning can significantly enhance how students grasp programming fundamentals. By combining interaction, visualization, and hands-on practice, students build confidence, curiosity, and problem-solving skills—key foundations for future work in computing and engineering.
Moving forward, similar sessions will continue to explore how interactive digital environments and intelligent scaffolding can further support meaningful learning in programming education.
Further UMPSA STEM Lab work on Slider Game and Digital Embodiment can be accessed here.
Bringing Python, IoT, and Physical Computing Together =)..
Today’s class marked an important milestone for DRE2213 – Programming and Data Structure, as students presented their final projects developed using Raspberry Pi and Python, with a strong focus on environmental sensing using the BME280 sensor. The SULAM session showcased not only technical competence, but also how far the students have progressed in applying programming concepts to real-world systems – in Perpustakaan UMPSA Pekan Monitoring System.
I am truly impressed by the level of achievement demonstrated by the students. Each group successfully implemented a complete IoT-based system, covering three essential components of modern embedded and data-driven applications.
1. Closed-Loop Sensor Integration
Students demonstrated their ability to build closed-loop systems by interfacing the BME280 temperature, humidity, and pressure sensor with the Raspberry Pi. Based on predefined threshold values, the system was able to trigger actuators such as LEDs and buzzers, reinforcing key concepts in sensor reading, decision-making logic, and control flow in Python.
2. Data Logging and Management
Another highlight was the diversity in data management approaches. Some groups opted for cloud-based databases such as Firebase, while others used Google Sheets or local storage solutions. This exposed students to different data structures, data persistence methods, and practical considerations in handling sensor data over time.
3. Dashboard Development and Visualization
Students also demonstrated creativity and flexibility in building dashboards to visualize sensor data. A wide range of tools were used, including:
HTML-based dashboards
Adafruit IO
Flask web applications
Streamlit dashboards
This variety reflects students’ growing confidence in selecting appropriate tools and frameworks to communicate data effectively.
From Games to Physical Systems – A Meaningful Learning Journey
At the beginning of this course, students were introduced to Python programming through a slider game developed using Pygame. This approach allowed them to grasp fundamental programming concepts—such as variables, loops, conditionals, and functions—within a digital and interactive environment.
As the course progressed, students transitioned from digital game development to physical computing projects, applying the same programming principles to real hardware and sensors. This combination of digital embodiment (game development) and physical embodiment (IoT systems) provided a strong foundation for understanding how software interacts with the real world.
Learning programming in an interactive and hands-on manner enables students to truly understand what their code is doing. Instead of writing abstract programs, they can see, hear, and measure the outcomes of their code—whether it is a game reacting to user input or a sensor triggering a buzzer based on environmental conditions.
Closing Reflections
Today’s presentations clearly demonstrated that interactive, project-based learning is an effective way to teach programming and data structures. By engaging with both digital and physical systems, students developed not only technical skills but also problem-solving confidence and design thinking.
Well done to all DRE2213 students on your excellent work. Your projects reflect strong effort, creativity, and meaningful learning. Keep building, keep experimenting, and keep pushing the boundaries of what you can create with Python and Raspberry Pi.
This week, Week 11, we reached an important milestone in the IoT learning journey. Building upon the foundations established in Weeks 9 and 10, this week’s activity focused on visualising sensor data through dashboards, using two different approaches:
A cloud-hosted dashboard using Adafruit IO
A self-hosted dashboard using HTML served directly from the Raspberry Pi Pico W (LilEx3)
By the end of this session, you no longer just reading sensors — but you’ve design a complete IoT data pipelines, from sensing to networking to visualisation.
This week is we transit our attention from collecting data to presenting data.
Using the BME280 environmental sensor, you are able to work with:
Temperature
Humidity
Atmospheric pressure
The same sensor data was then visualised using two different dashboard approaches, highlighting important design choices in IoT systems.
Approach 1: Cloud Dashboard Using Adafruit IO – Refer to Act 7 in TINTA and Google Classsroom
This method introduces students to cloud-based IoT platforms, a common industry practice.
Key concepts:
WiFi connectivity
MQTT protocol
Publishing data to a third-party server
Remote access and visualisation
Code Explanation (Adafruit IO Method)
from machine import Pin, I2C

import network

import time

from umqtt.simple import MQTTClient

import bme280
Imports modules for hardware control, networking, MQTT communication, and the BME280 sensor.
Reads sensor values and publishes temperature data to the cloud dashboard.
This approach shows how sensor data can be accessed anywhere in the world, but depends on external services and internet connectivity.
Approach 2: Self-Hosted HTML Dashboard on Pico W
This method shifts learning toward edge computing and embedded web servers.
Key concepts:
HTTP client–server model
Serving HTML from a microcontroller
JSON data exchange
JavaScript-based live updates
Local network dashboards
Code Explanation (HTML Dashboard Method)
import socket
Enables the Pico W to act as a web server.
html = """<html>...</html>"""
Stores the dashboard webpage directly in Python memory.
s = socket.socket()

s.bind(('0.0.0.0', 80))

s.listen(1)
Starts an HTTP server on port 80.
if"/data"in request:
Distinguishes between:
Page requests (/)
Data requests (/data)
values = bme.values
Reads temperature, humidity, and pressure in real time.
fetch('/data')
JavaScript on the webpage periodically requests new sensor data and updates the display without refreshing the page.
This approach emphasizes system integration, where the device itself becomes the dashboard — similar to ground stations and embedded monitoring panels.
Comparing Both Dashboard Approaches
Feature
Adafruit IO
HTML on Pico W
Hosting
Cloud
Local (device)
Internet required
Yes
Local WiFi only
Protocol
MQTT
HTTP
Complexity
Lower
Higher
Control
Limited
Full
Educational value
Intro to IoT cloud
Full-stack IoT
Both approaches are valuable, and understanding when to use each is an important engineering skill.
Bringing It All Together
By connecting:
Weeks 9 & 10 (MPU6050 motion sensing & data logging)
Week 11 (IoT dashboards and networking)
you are now capable of:
Interfacing multiple sensors
Logging and processing data
Transmitting data over networks
Designing dashboards (cloud and local)
Building complete IoT systems
At this stage, you are no longer following isolated tutorials, but are now ready to design and execute their own IoT projects.
This week, you’ve gone thru to one of the most exciting aspects of embedded systems and sensor-based computing: collecting, processing, and logging motion data using the MPU6050 sensor. Working with the LilEx3 – our in-house Raspberry Pi Pico–based picosatellite simulator, you explored how real satellites interpret motion, orientation, and attitude information through microcontrollers and built-in algorithms.
This activity was designed not only to strengthen understanding of Python programming on microcontrollers, but also to demonstrate how sensor data can be captured, logged, and interpreted, a fundamental skill in IoT, robotics, aerospace, and scientific computing.
1. Introducing the MPU6050 Sensor
The MPU6050 combines a 3-axis accelerometer and 3-axis gyroscope, allowing us to detect:
Linear acceleration (AX, AY, AZ)
Angular velocity (GX, GY, GZ)
Motion patterns
Orientation of a device in space
In satellite engineering, this type of sensor is crucial for:
Attitude determination
Stabilisation
Orientation control
Deployment sequence monitoring
For our LiLex3 picosatellite simulator, this data helps you to understand how satellites “sense” their position and respond to environmental changes.
2. Python Programming on the Raspberry Pi Pico
Acomplishing the task, you wrote MicroPython code to:
Initialise the I2C communication bus
Read real-time sensor values
Display values on the Thonny console
Log data into a .txt file for later analysis
This hands-on exercise strengthened key Python concepts:
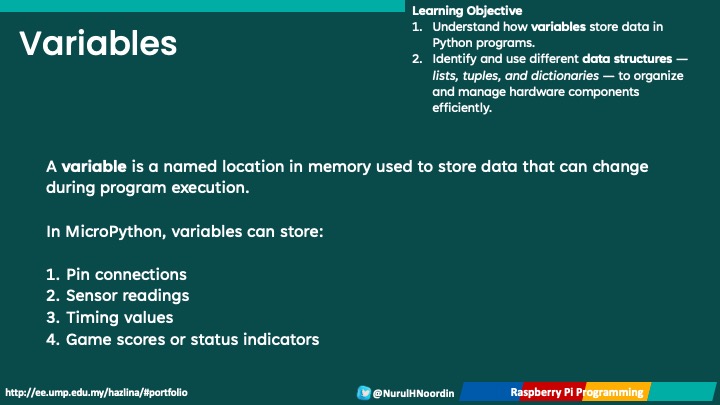
Variables & Data Types
You handled multiple numeric readings and stored them in variables such as ax, ay, az.
Functions & Modular Code
They used functions like mpu.values() and learned how functions return multiple sensor readings at once.
Loops
A continuous while True: loop was used to collect real-time data every second.
File Handling
One of the most important skills today was learning how to open, write, and save data to a file—essential for logging experiments.
This allowed the Pico to create a growing dataset, which you can later open in Excel for plotting or further analysis.
Printing to Console
The real-time values were also displayed in the Thonny console, helping you can visualize live changes as they physically moved the LiLex3 module.
3. Experiencing Motion: Determining Roll, Pitch, and Yaw
Rather than reading just “raw numbers,” you were tasked to interpret meaning behind the MPU6050 readings.
Through controlled physical movement of the LiLex3:
Pitch changed when tilting forward/backward
Roll changed when tilting left/right
Yaw changed when rotating horizontally (similar to turning a compass)
By observing accelerometer and gyroscope patterns, you began to understand how flight controllers, drones, and satellites estimate their orientation in space.
This experience reinforces why MPU data is vital in aerospace applications:
CubeSat attitude determination
Drone flight stabilization
Rocket telemetry
Robotics navigation
VR/AR motion tracking
Then you were encouraged to mark down the sensor readings corresponding to specific movements and attempt simple calculations for roll/pitch/yaw using standard trigonometric formulas (e.g., atan2).
4. Data Logging: Building a Dataset for Analysis
One of the biggest takeaways was the importance of data logging.
By saving values into a .txt file, you learned how to:
Record experimental data
Align timestamps and readings
Import the file into Excel
Plot sensor graphs (AX vs. time, pitch changes, etc.)
Observe patterns corresponding to movement
This introduces to real scientific data workflows used in:
Research experiments
IoT sensor monitoring
Engineering testing
Satellite mission data collection
The logged dataset becomes the “flight log” for their miniature picosatellite simulator.
5. Conclusion: Why Today’s Activity Matters
Today’s class was not just about wiring a sensor and reading numbers. It was about understanding how real systems sense, interpret, and record the world around them.
You learned:
Embedded Python programming
Real-time sensor acquisition
Data logging techniques
Interpreting physical motion through numerical patterns
Satellite-style orientation measurement
By the end of the session, every student had generated their own dataset and gained insight into how satellites determine roll, pitch, and yaw—all through hands-on experimentation with the LiLex3 and MPU6050.
This activity bridges classroom concepts with real aerospace and IoT engineering, preparing you for more advanced missions involving filtering (Kalman), attitude determination, and flight-control algorithms.
This week we move forward to explored how data structures and programming concepts come to life through the Raspberry Pi Pico. We completed Activity 1 (Digital Output), Activity 2 (Traffic Light), and Activity 3 (Digital Input), each introducing a new layer of understanding in Python programming and physical computing.
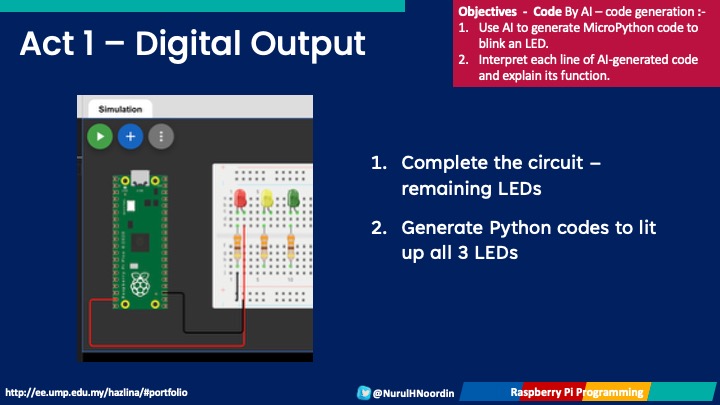
Activity 1 – Digital Output: Lighting Up with Variables
We began with the most fundamental task, turning an LED ON and OFF. Through this, students learned:
How to define and use variables to store pin numbers and LED states
How data types like integers and booleans control hardware behavior
How to send output signals using the Pin() function and .on()/.off() commands
This activity established the foundation for understanding how code interacts with physical devices. Also, we make use of Wokwi online simulator, which is good especially in learning the basic concepts.
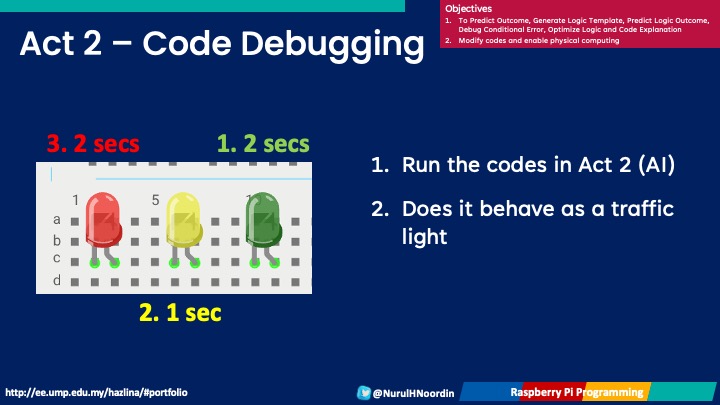
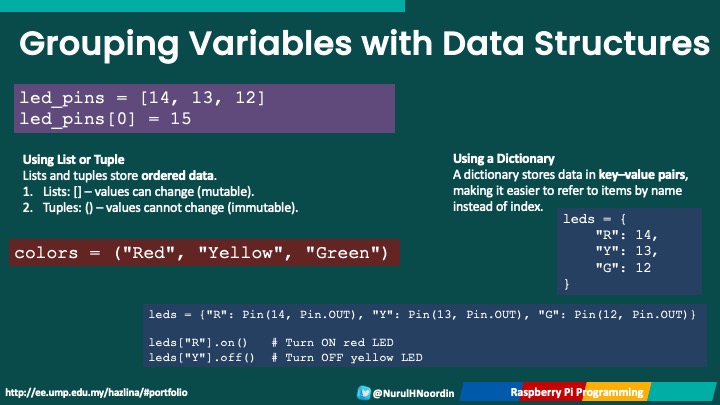
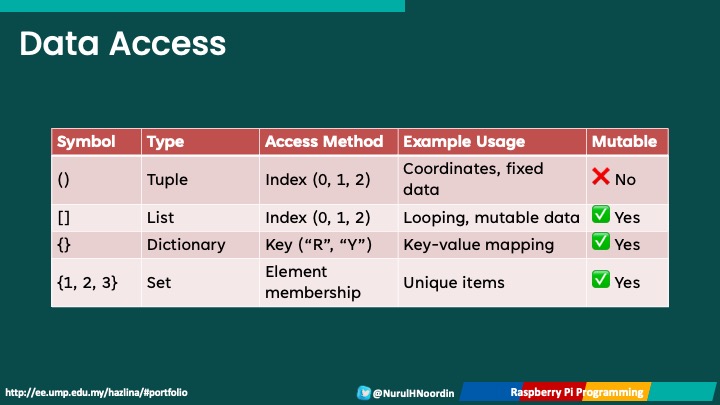
Activity 2 – Traffic Light Simulation: Learning Data Structures
Next, we built a traffic light simulation using three LEDs (Red, Yellow, Green). Here, students experimented with different data structures to organize and control multiple outputs:
Lists ([]) to store LED pins in a sequence
Tuples (()) for fixed sets of pins
Dictionaries ({}) to label LEDs for clarity ("R": 14, "Y": 13, "G": 12)
They also explored how to simplify code using loops and sleep statements to manage timing:
for led in leds:

led.on()

time.sleep(1)

led.off()
This hands-on activity demonstrated how data organization directly impacts code simplicity and readability.
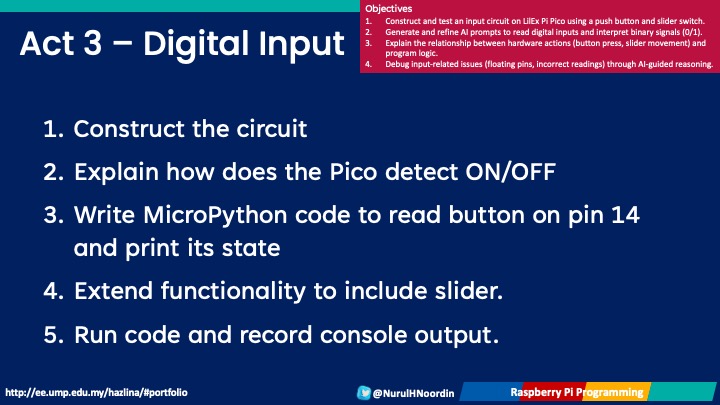
Activity 3 – Digital Input: Reading from Buttons and Switches
The third activity introduced digital input, connecting push buttons and slider switches to the Raspberry Pi Pico. Students learned to:
Read input values (0 or 1)
Use conditional statements (if/else) to make the LED respond to user actions
Understand Boolean logic and how it drives interactivity in real-world systems
This activity tied together input → process → output, emphasizing the logic flow that underpins all embedded systems.
Through these activities, you’ve not only focued on the essential coding techniques but also explored core data structures that make programs efficient and scalable. Understanding how lists, tuples, and dictionaries manage data sets the stage for more complex IoT and sensor-based applications in upcoming sessions.
Next week, we’re having Midterm Test =).
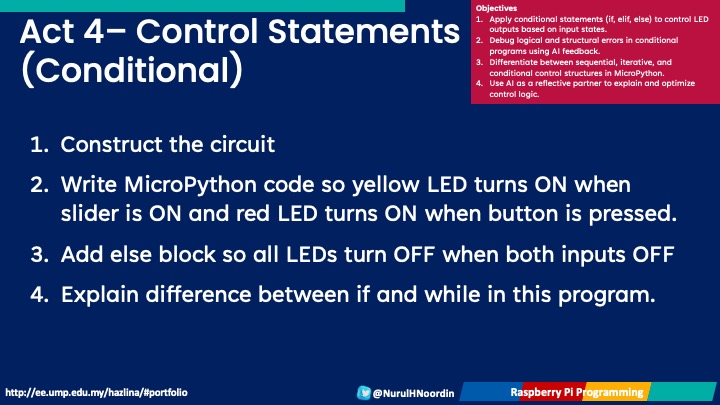
We’ll continue building upon these concepts as we move toward conditional programming and sensor integration, after the midterm break. Great work everyone — keep experimenting, debugging, and learning by doing!