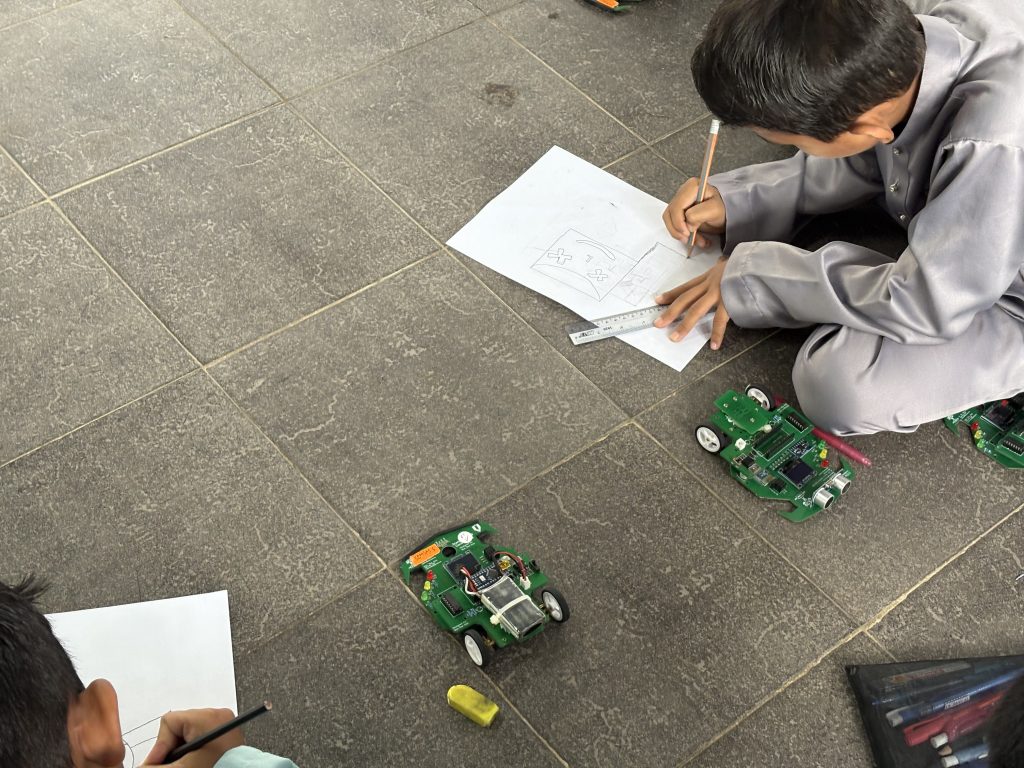
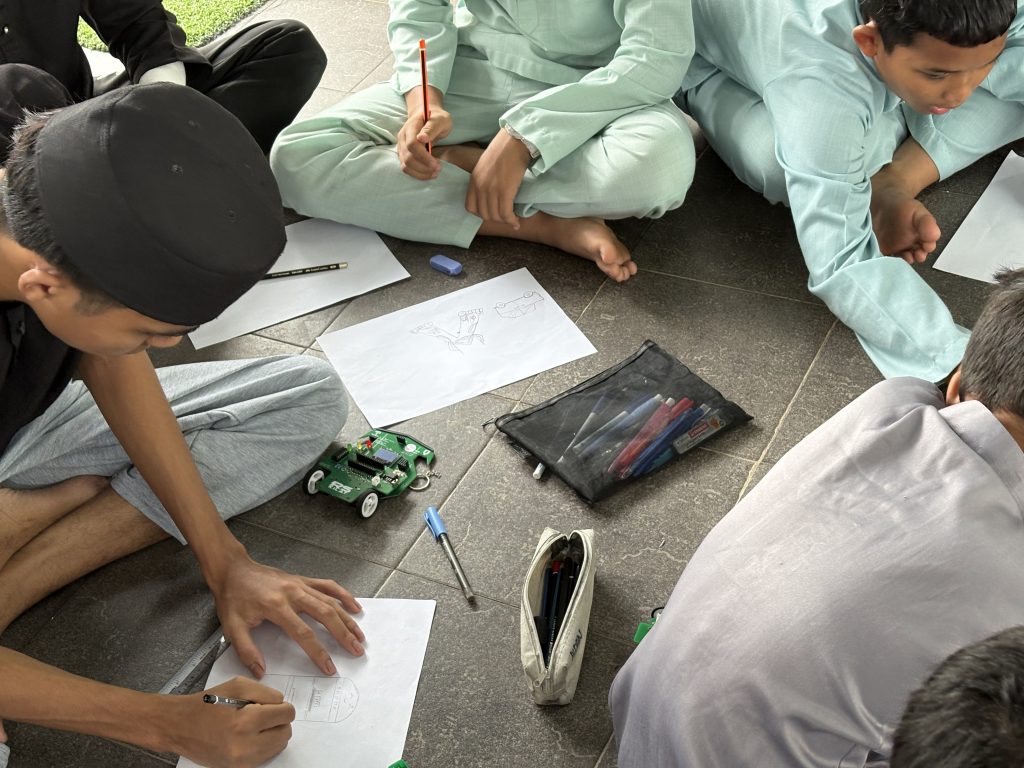
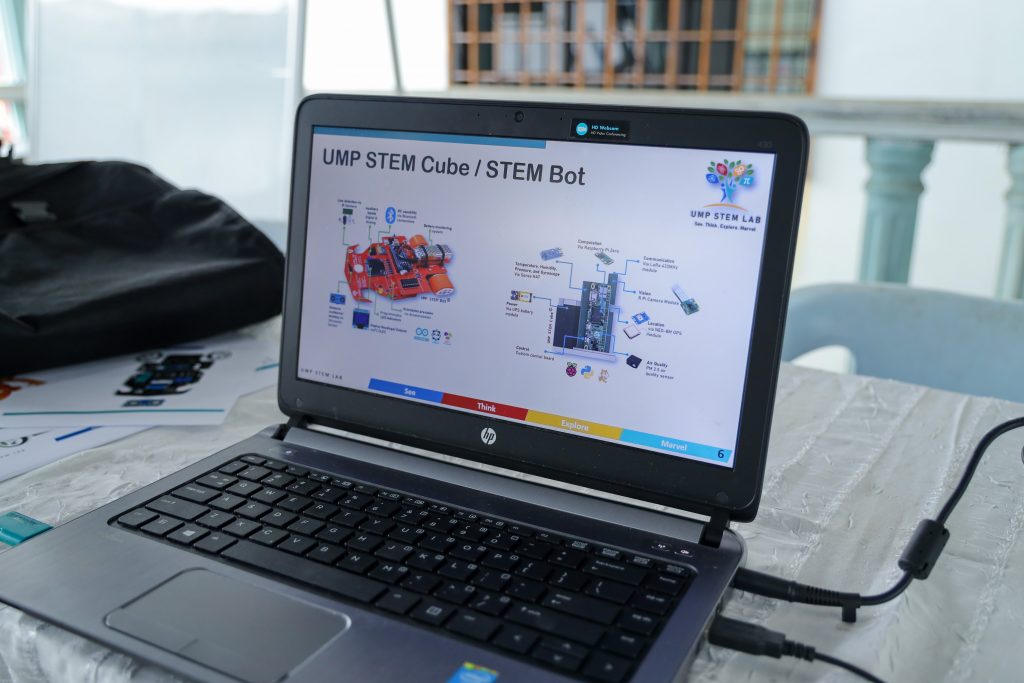
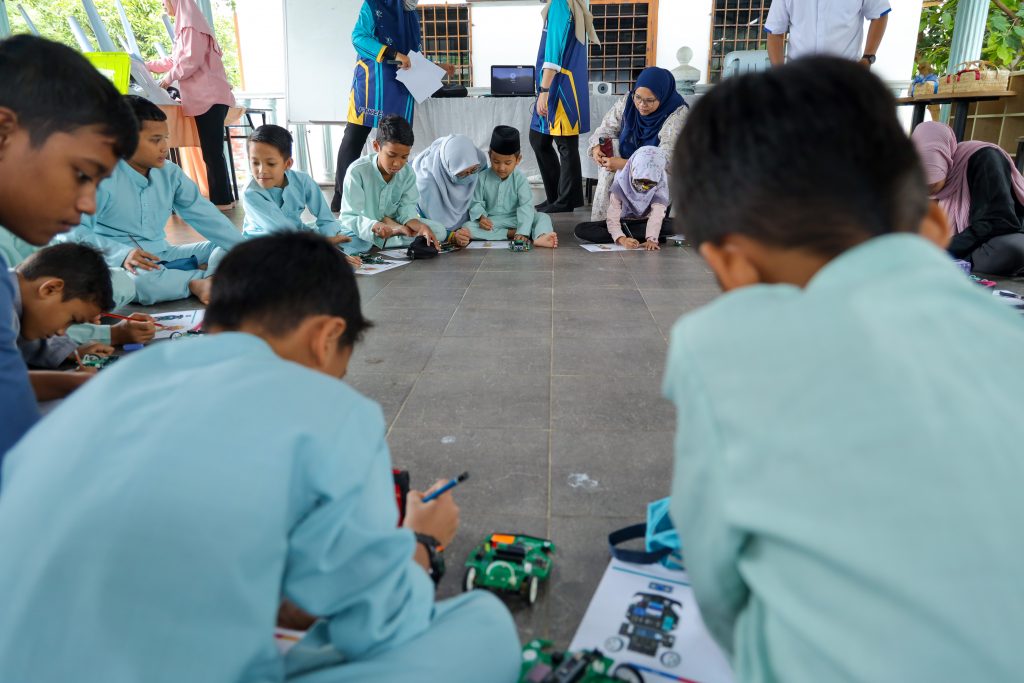
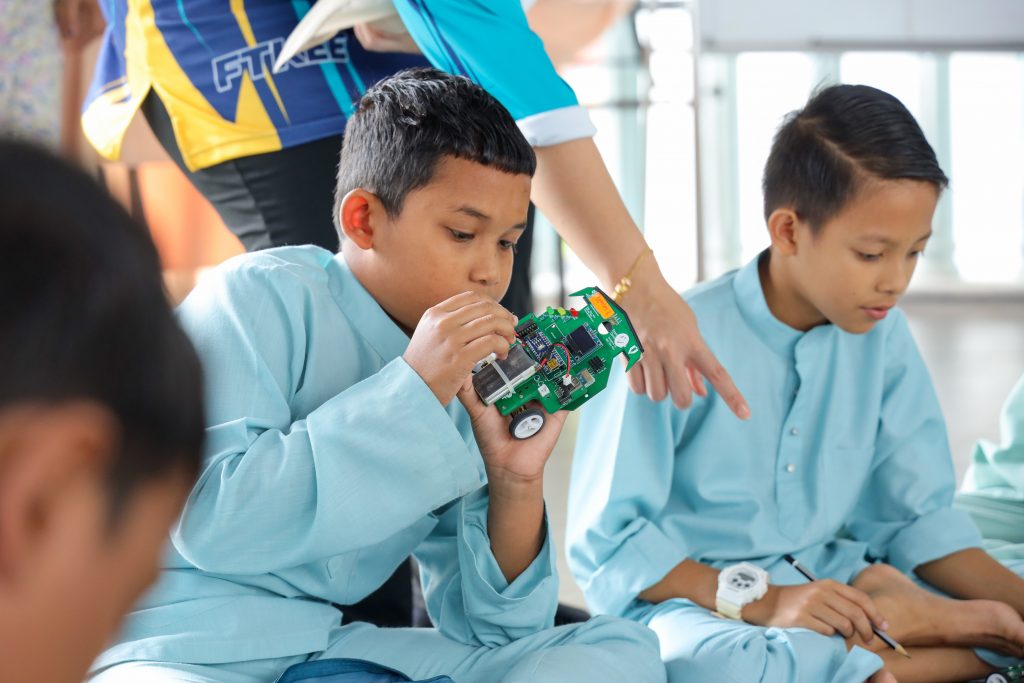
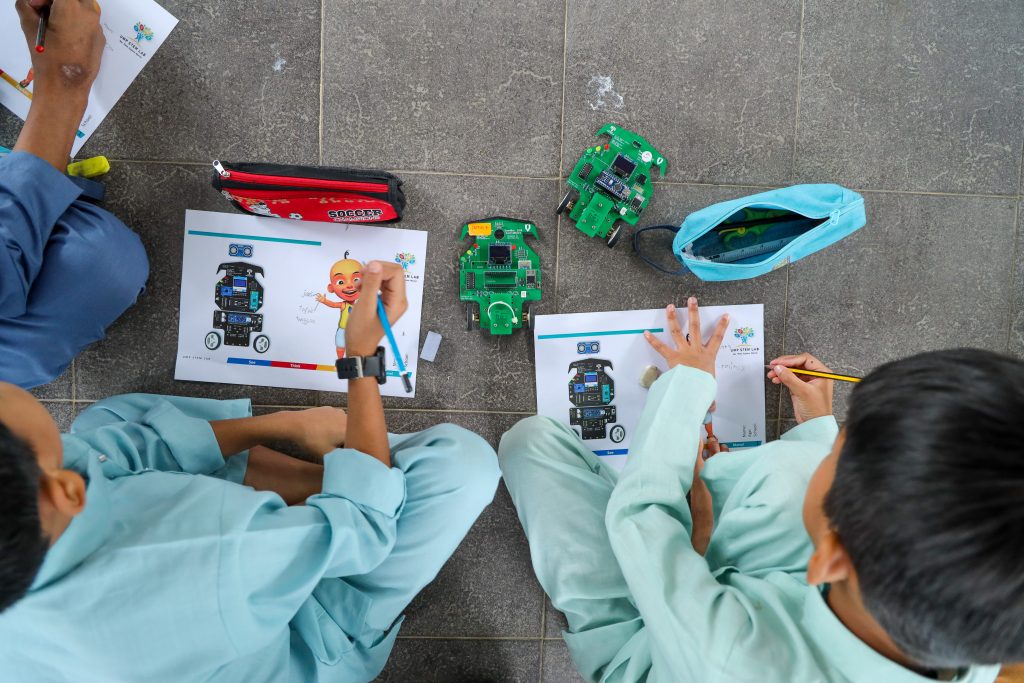
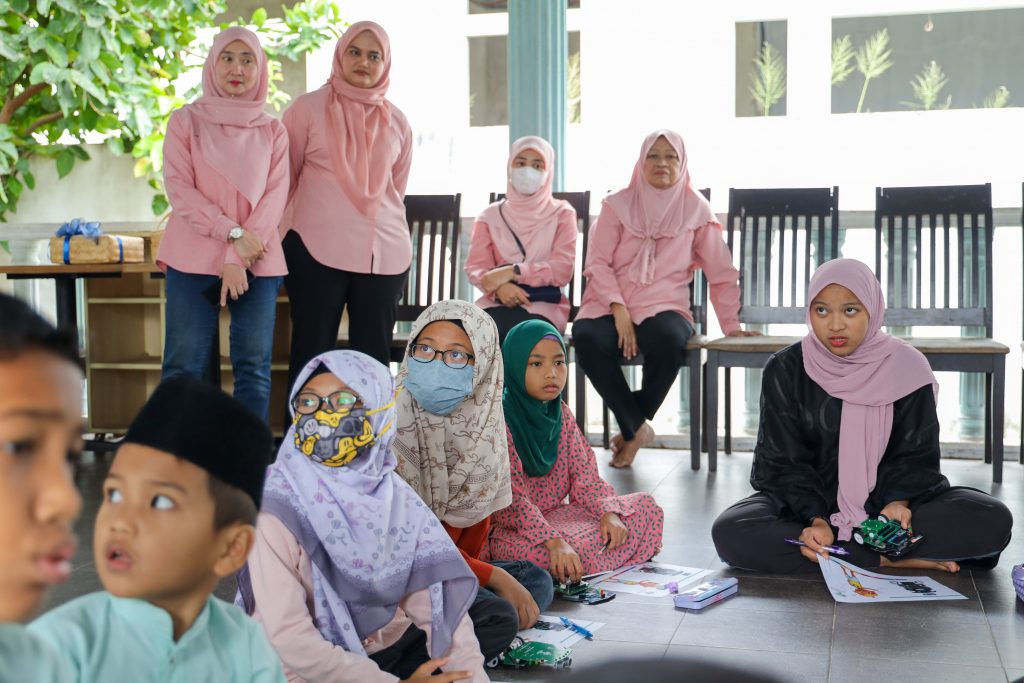
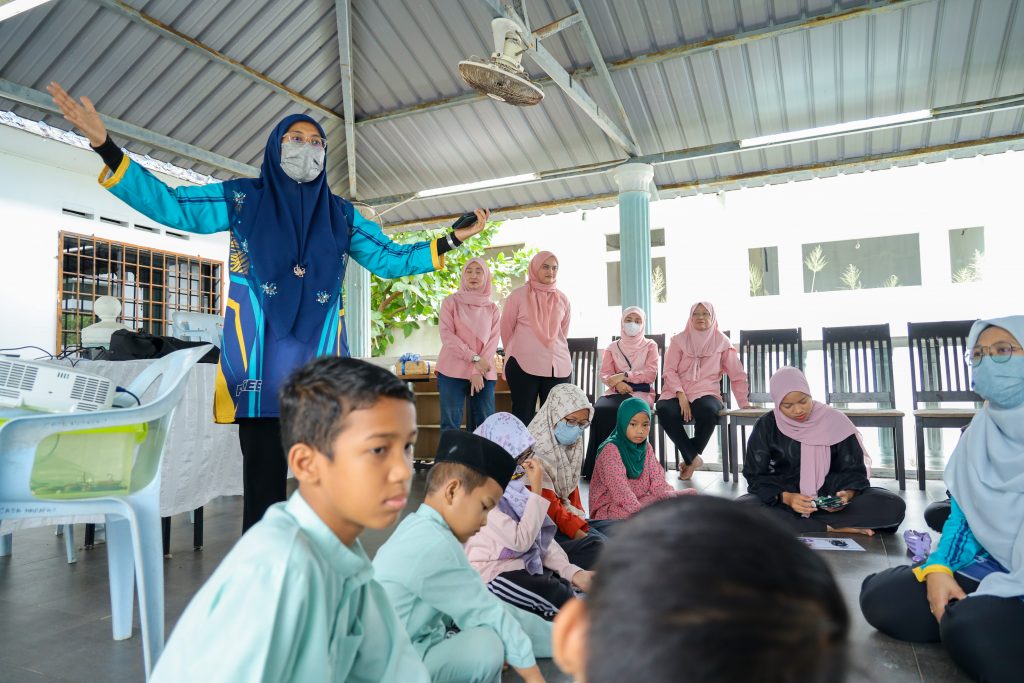
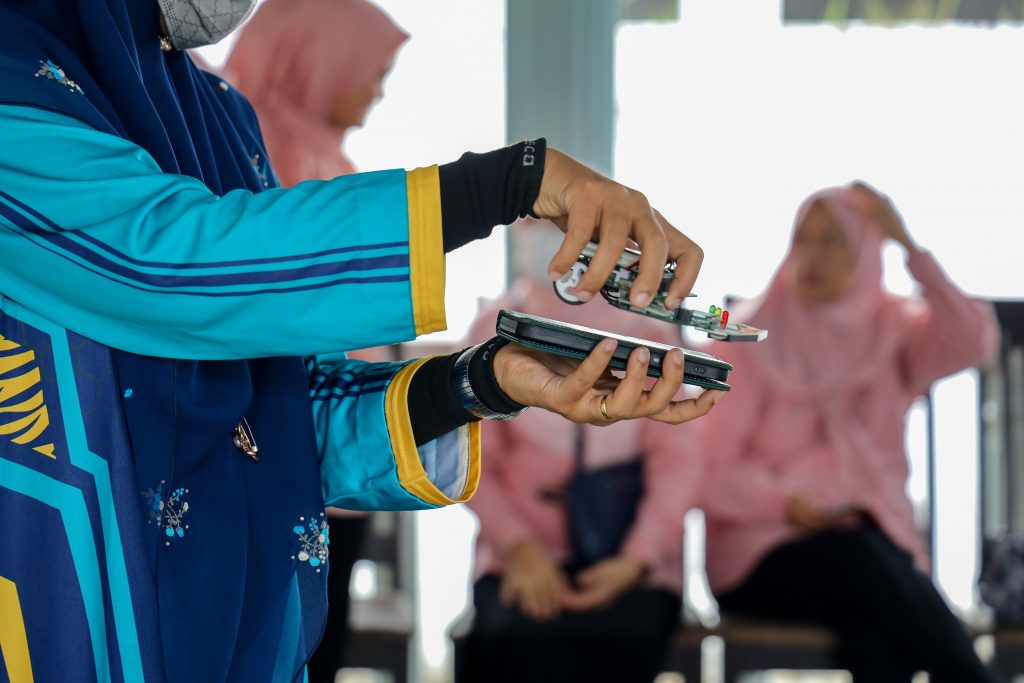
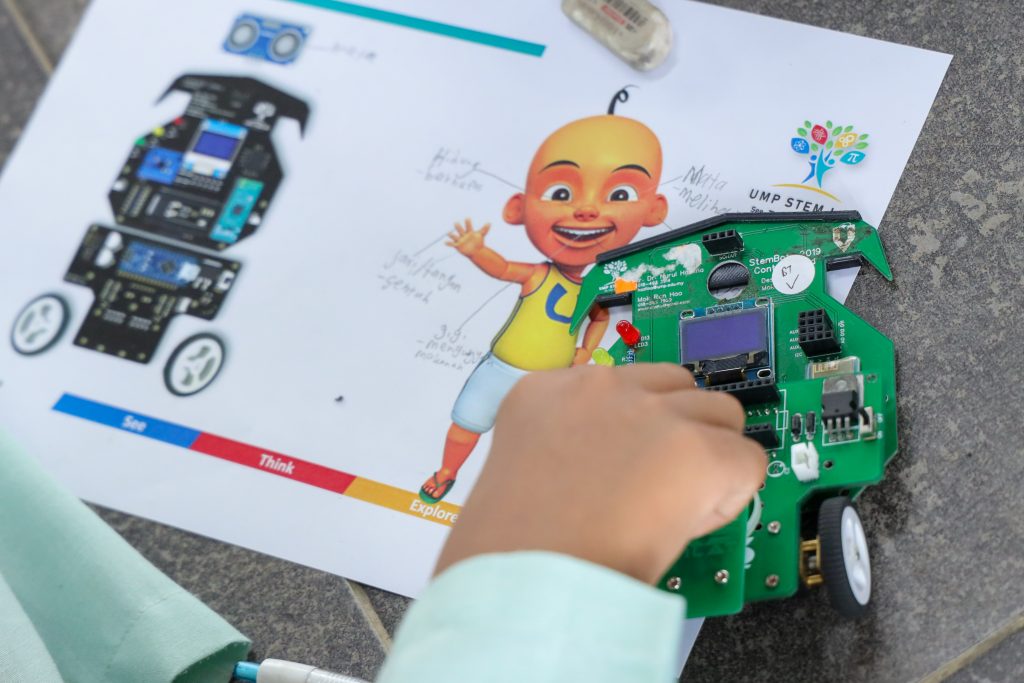
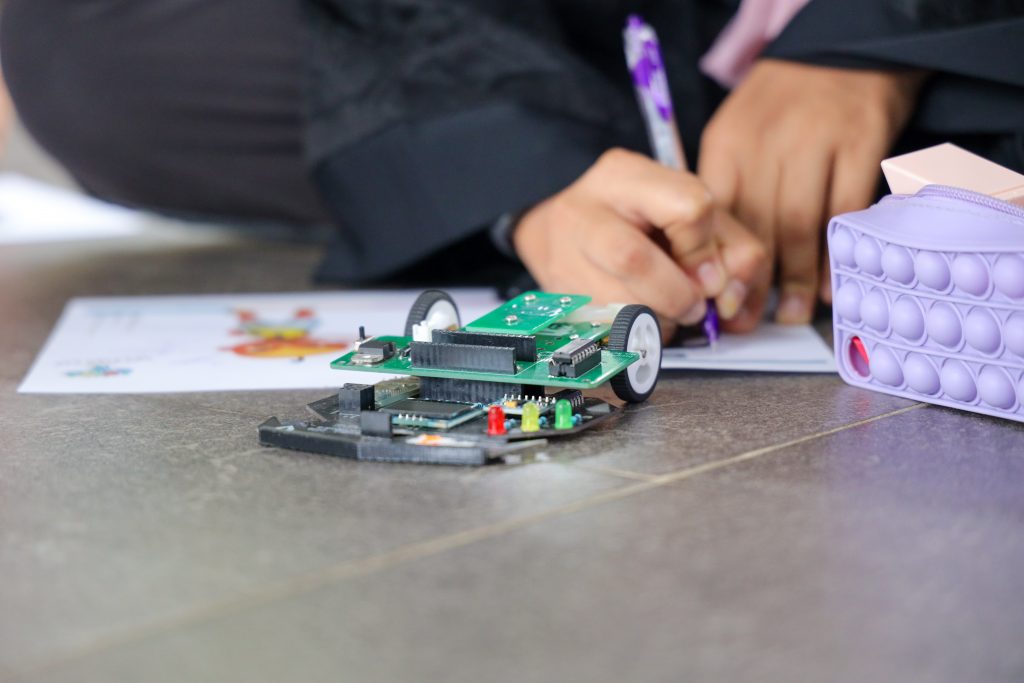
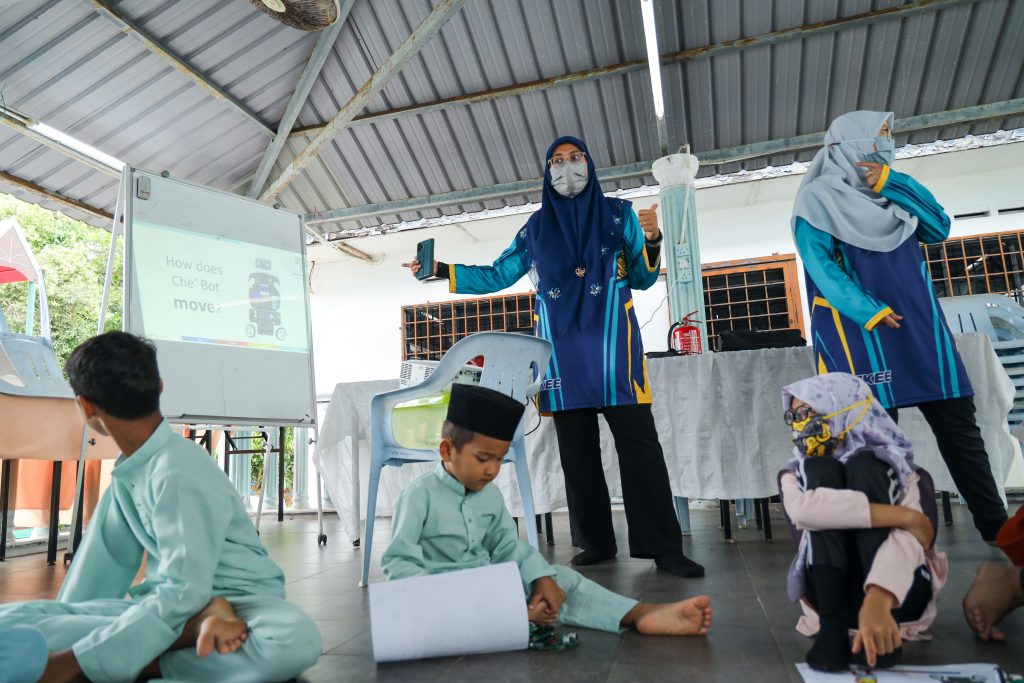
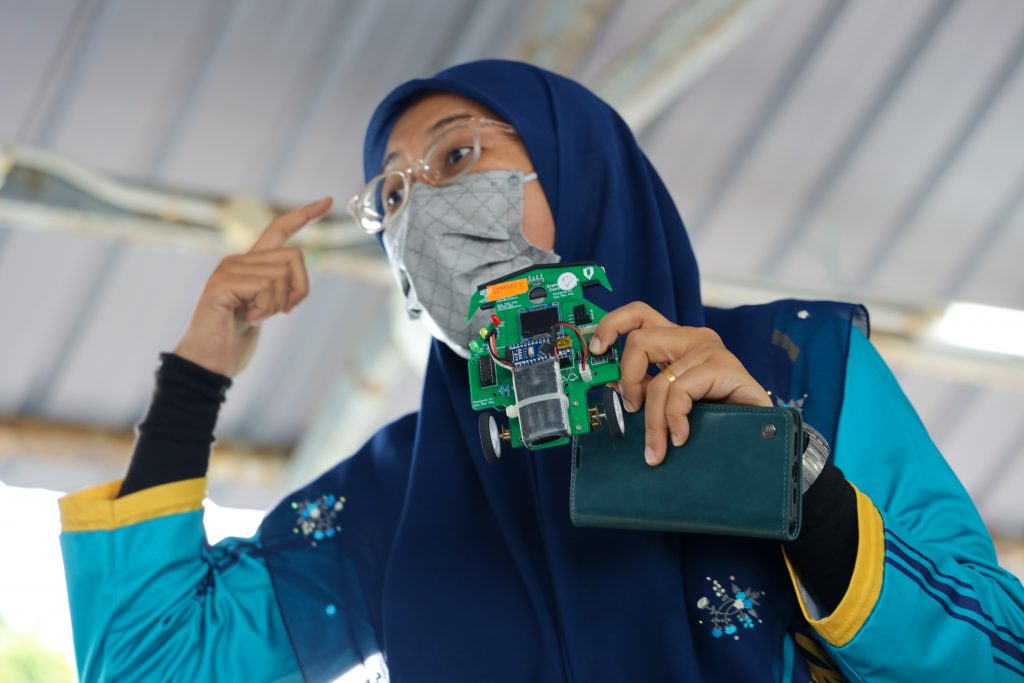
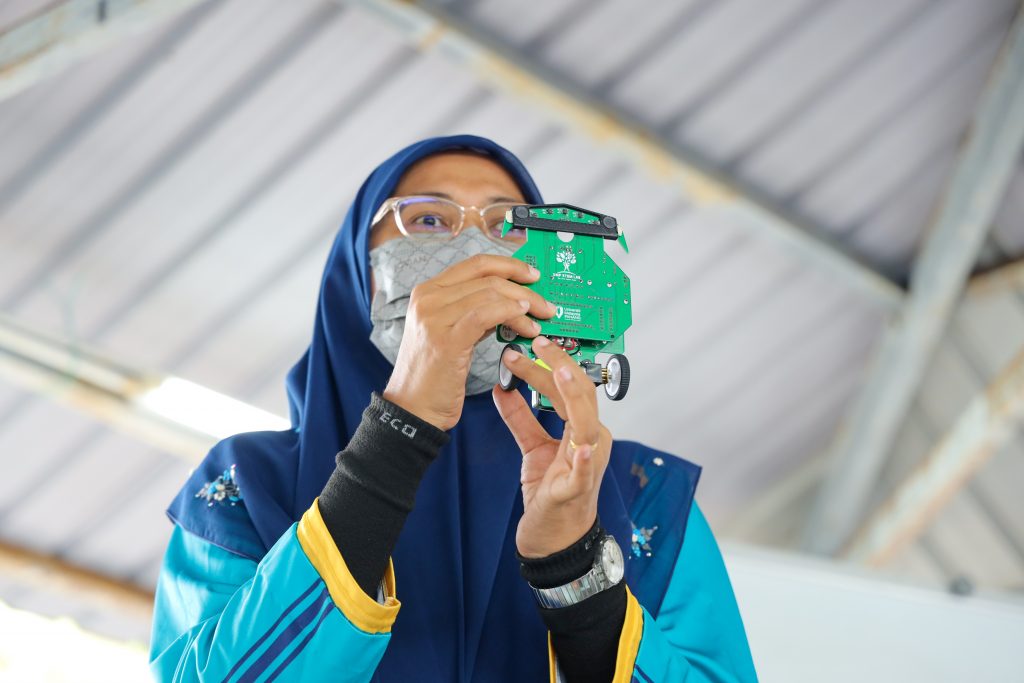
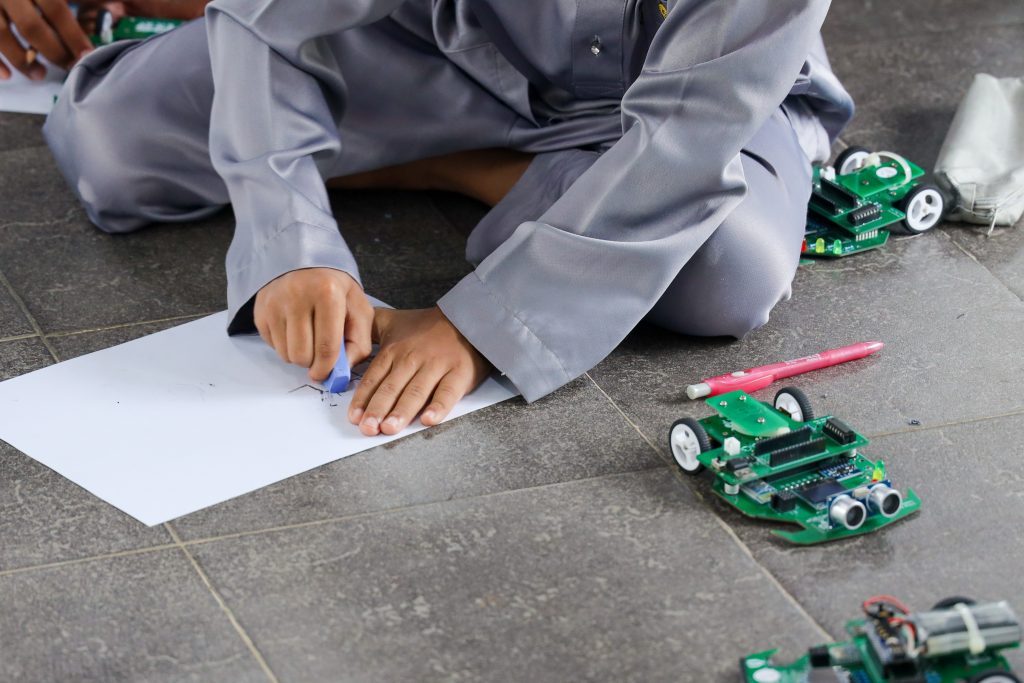
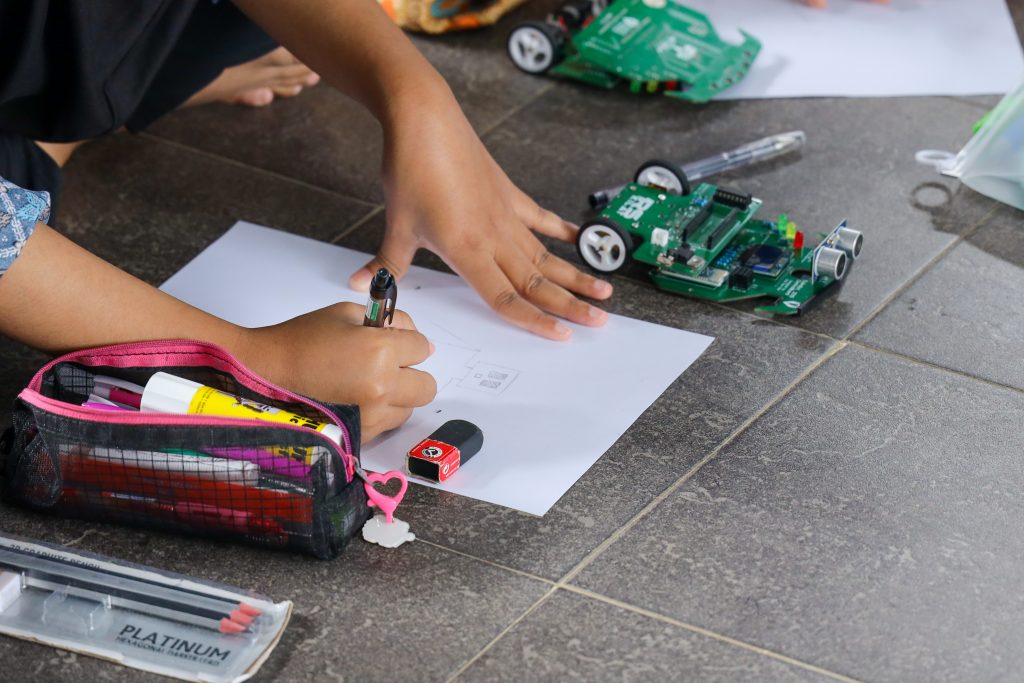
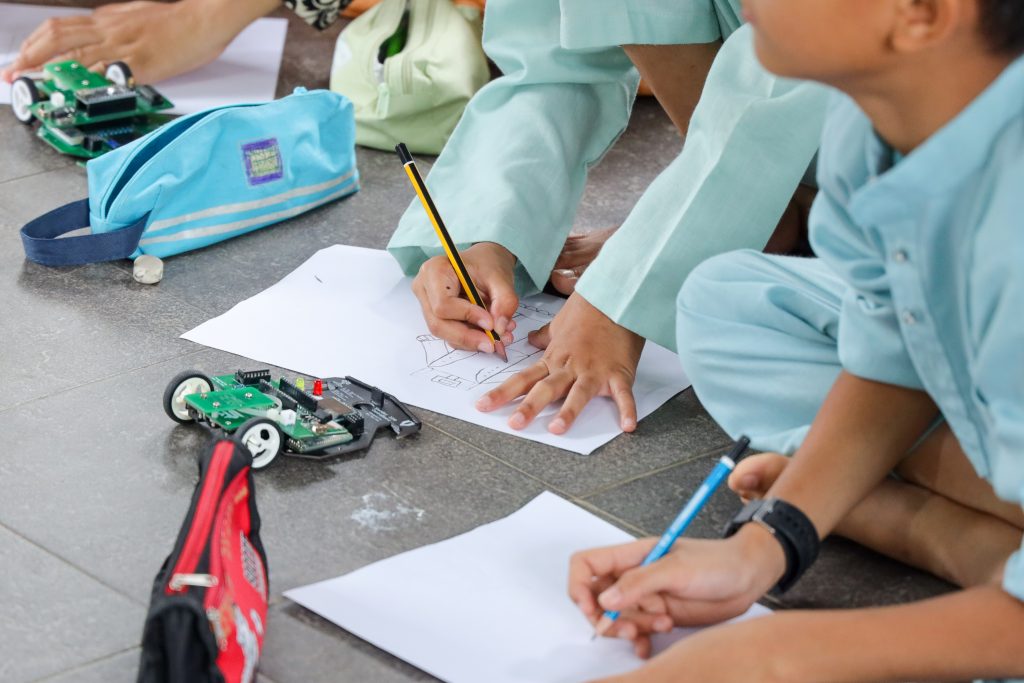
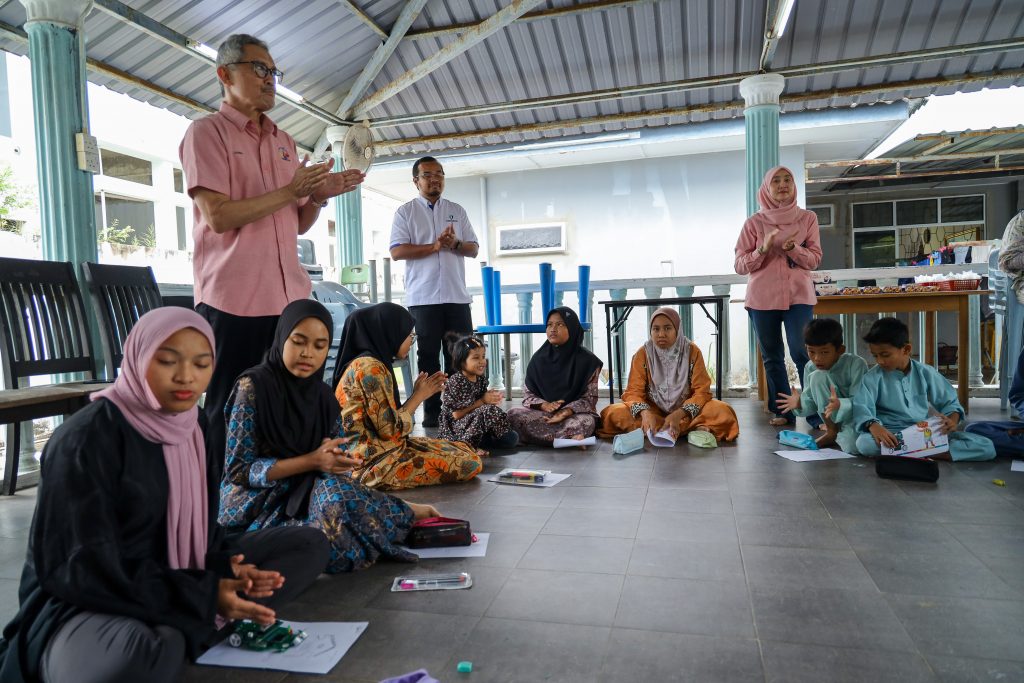
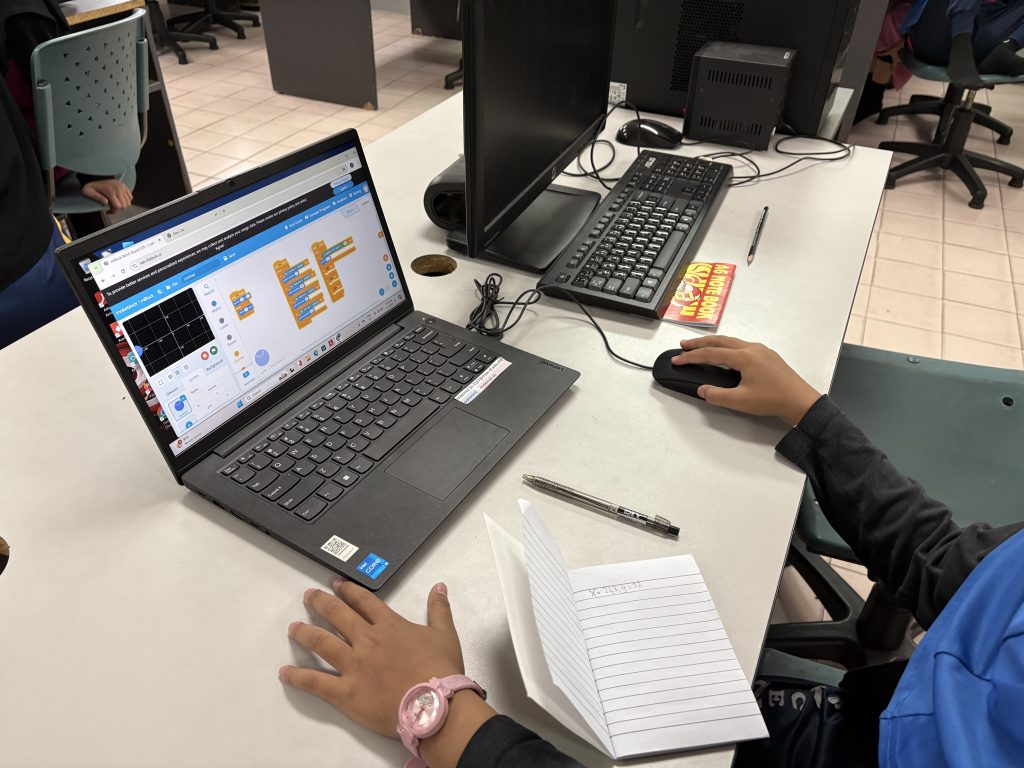
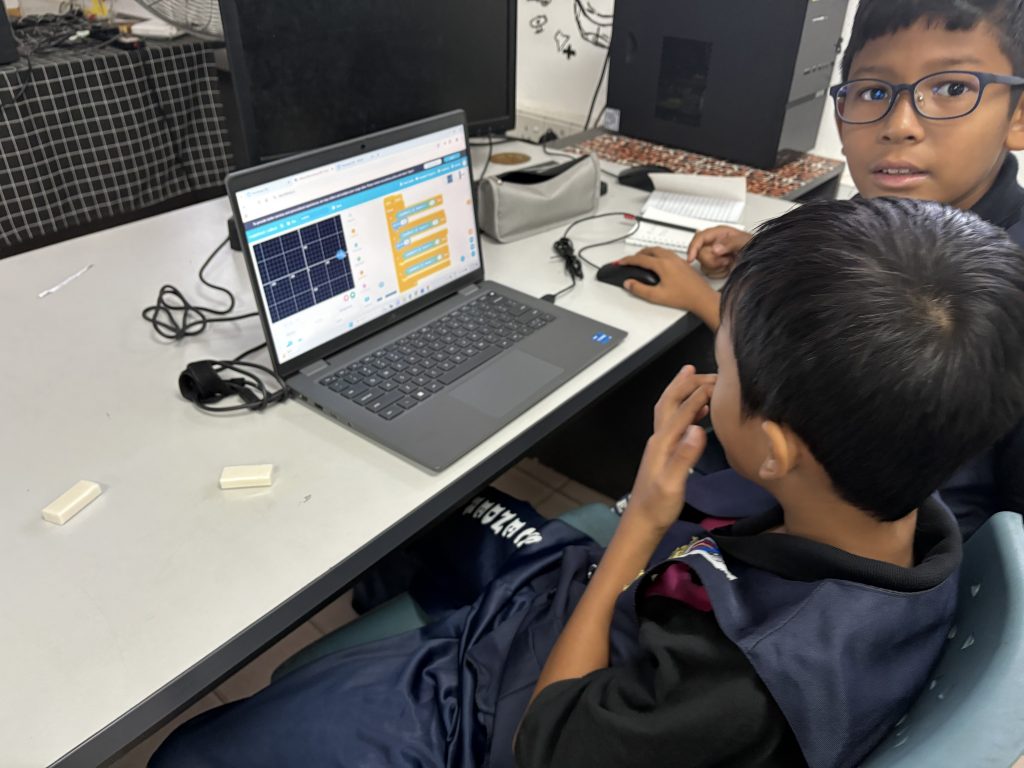
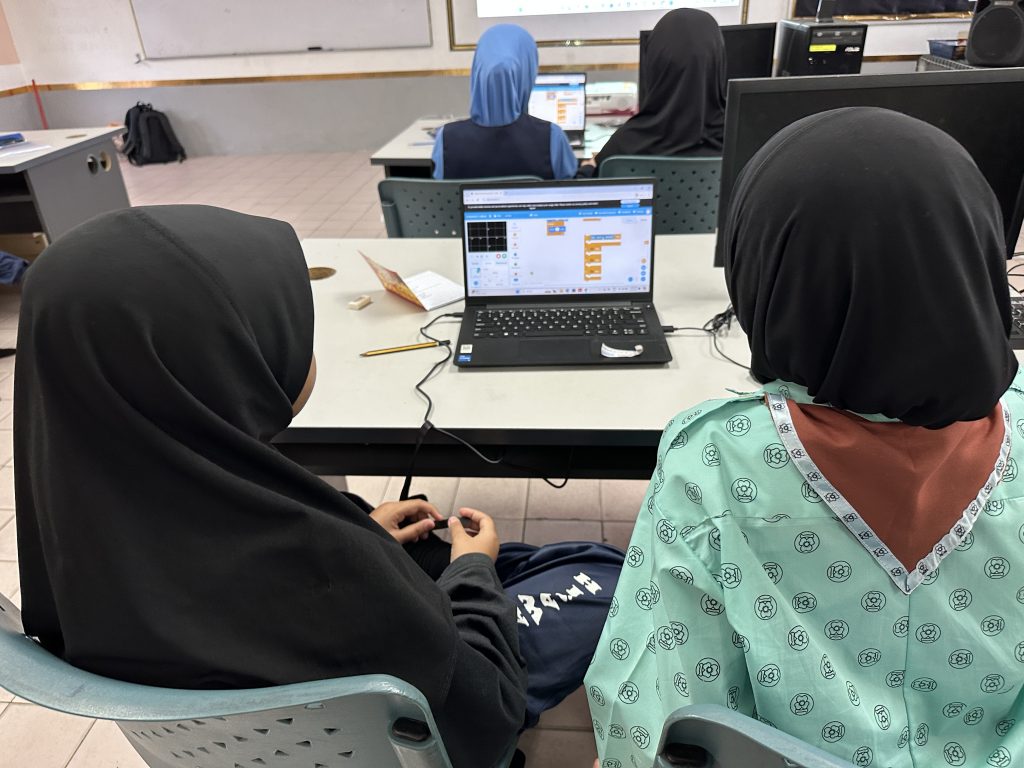
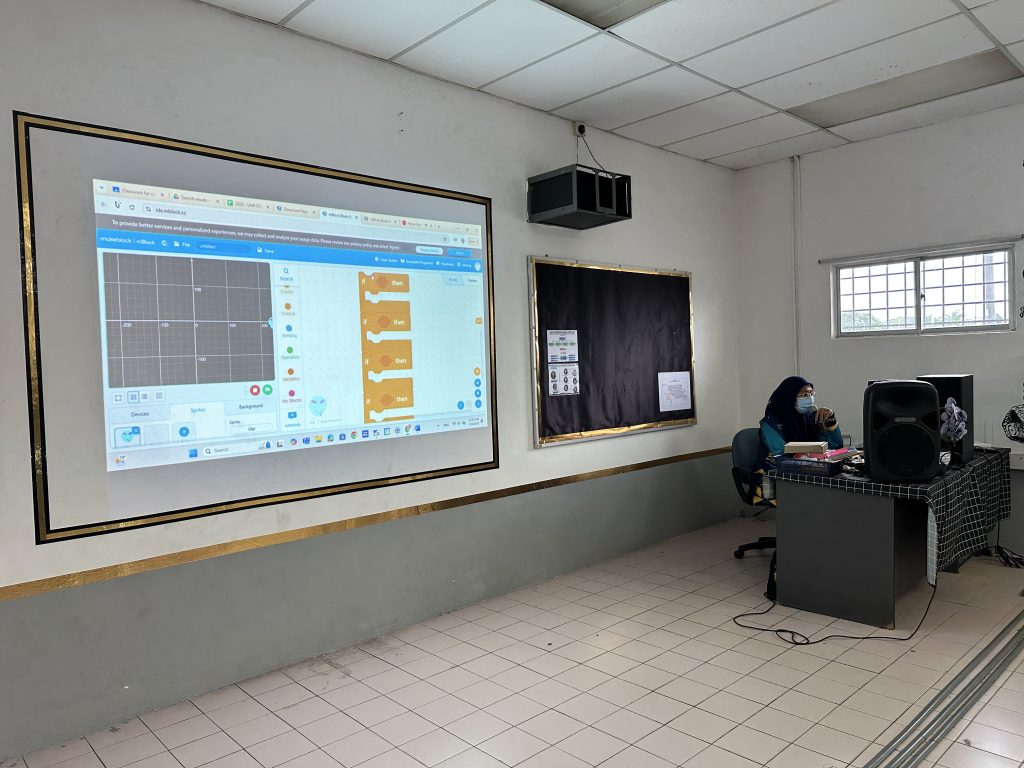
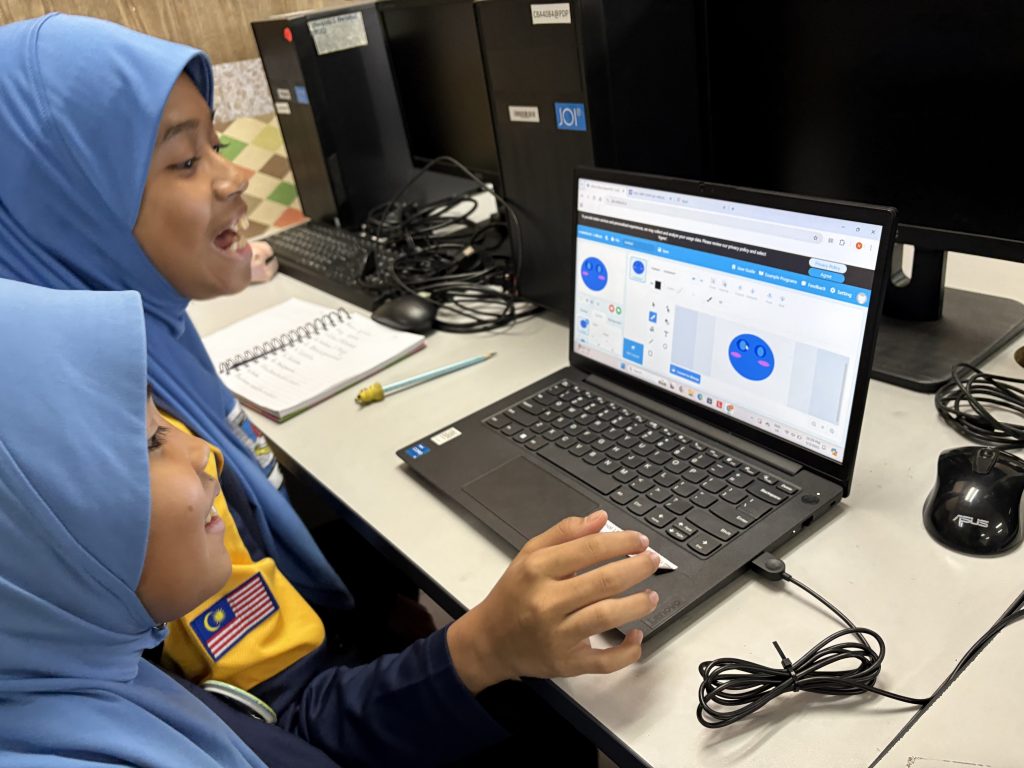
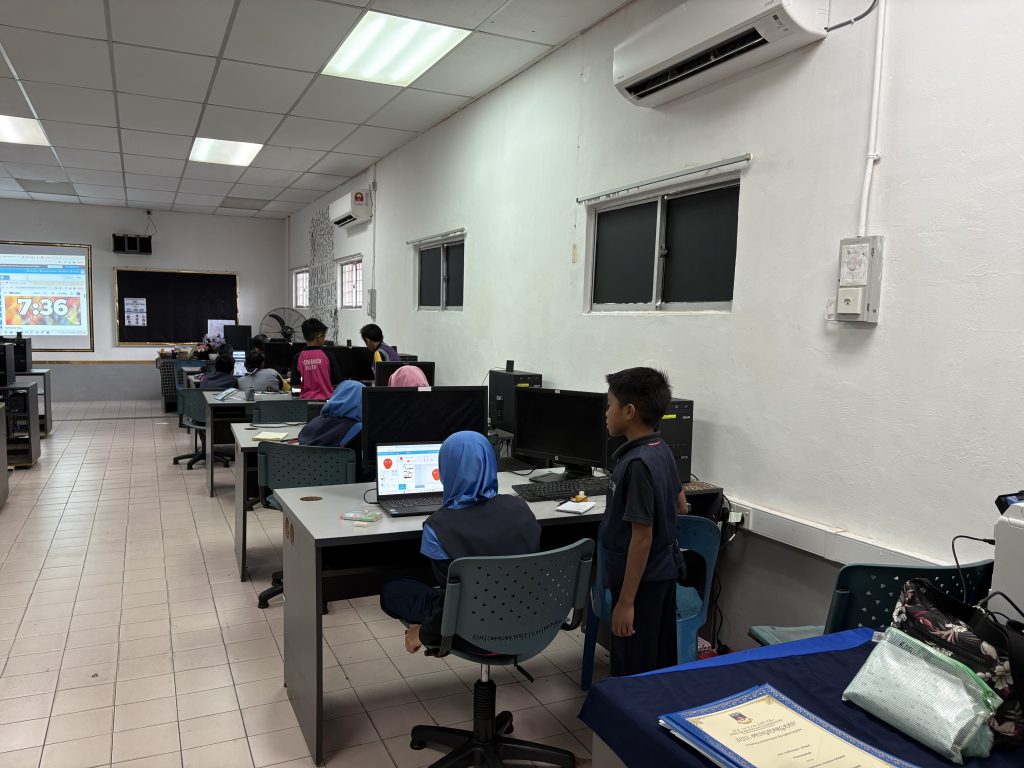
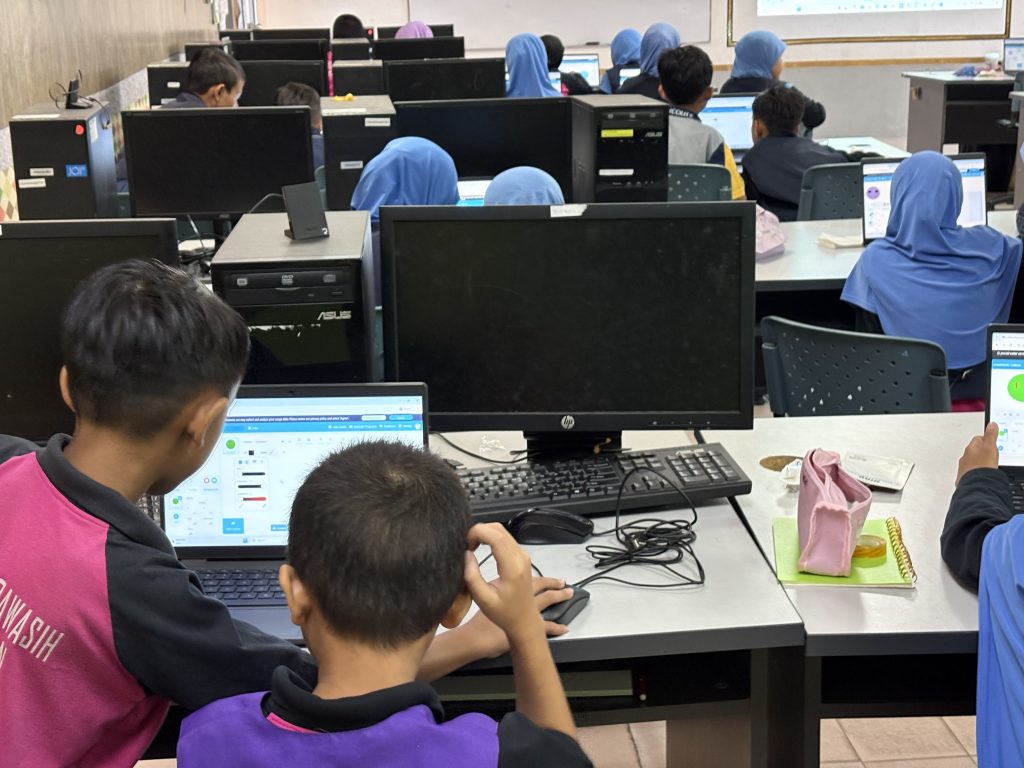
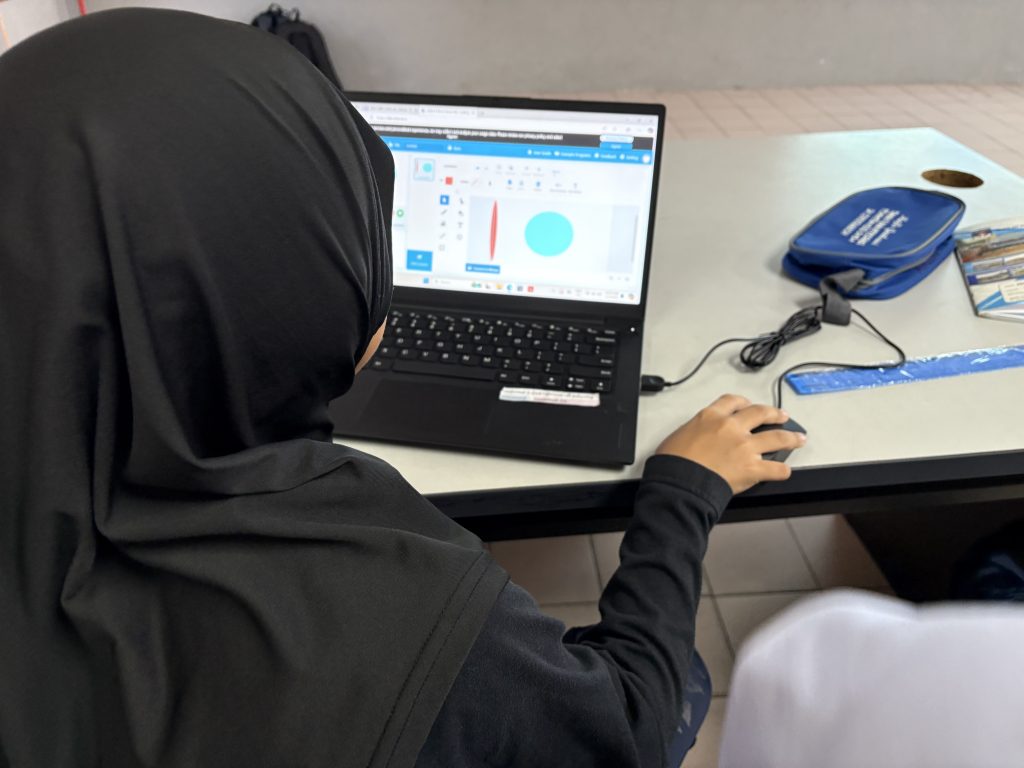
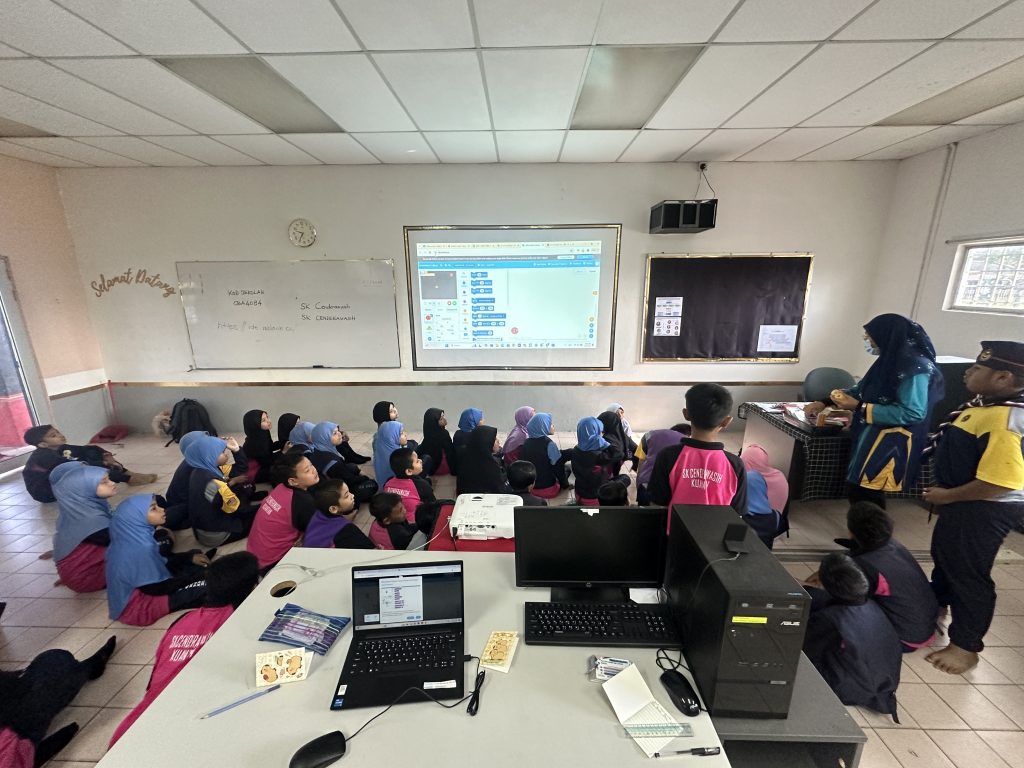
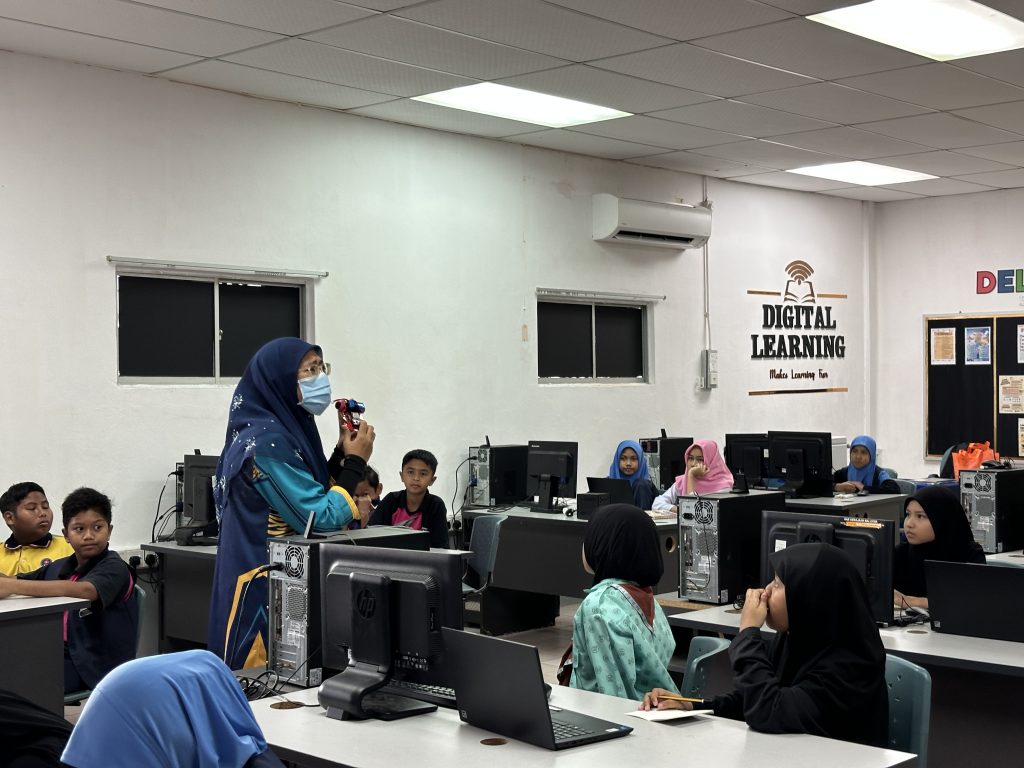
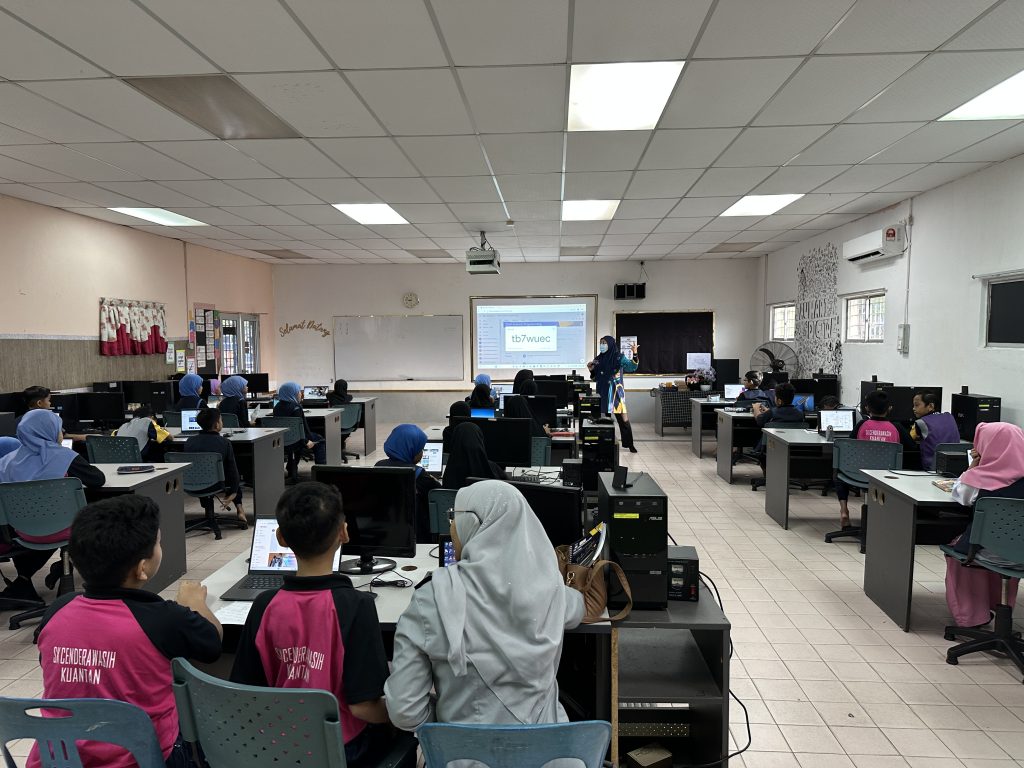
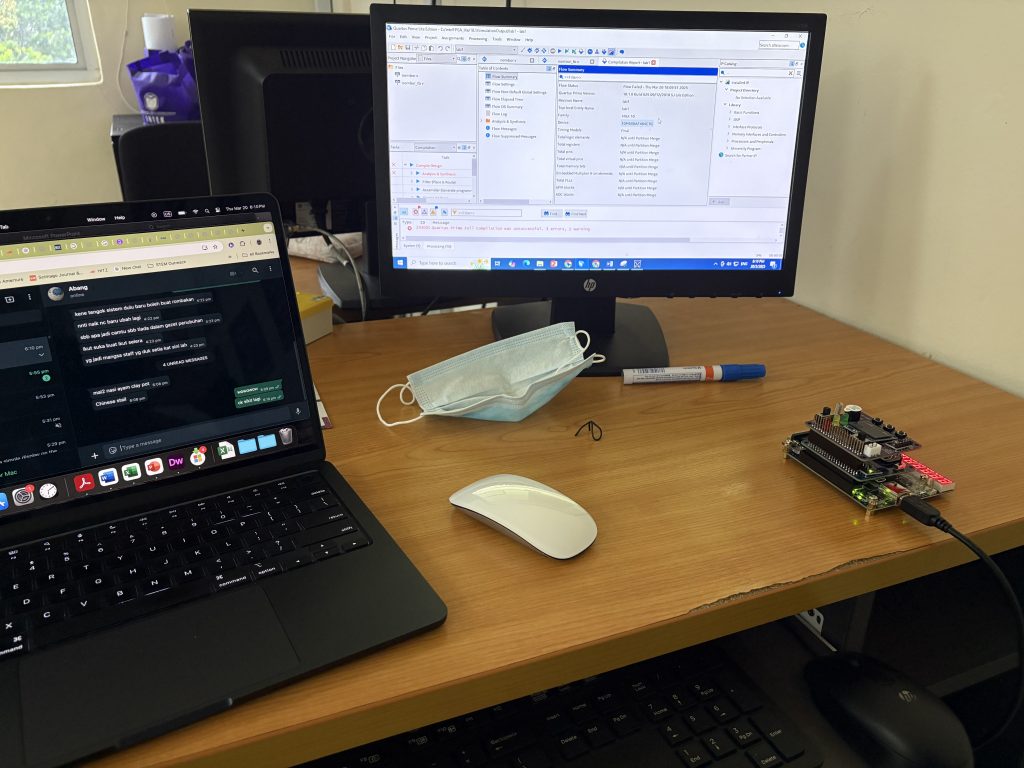
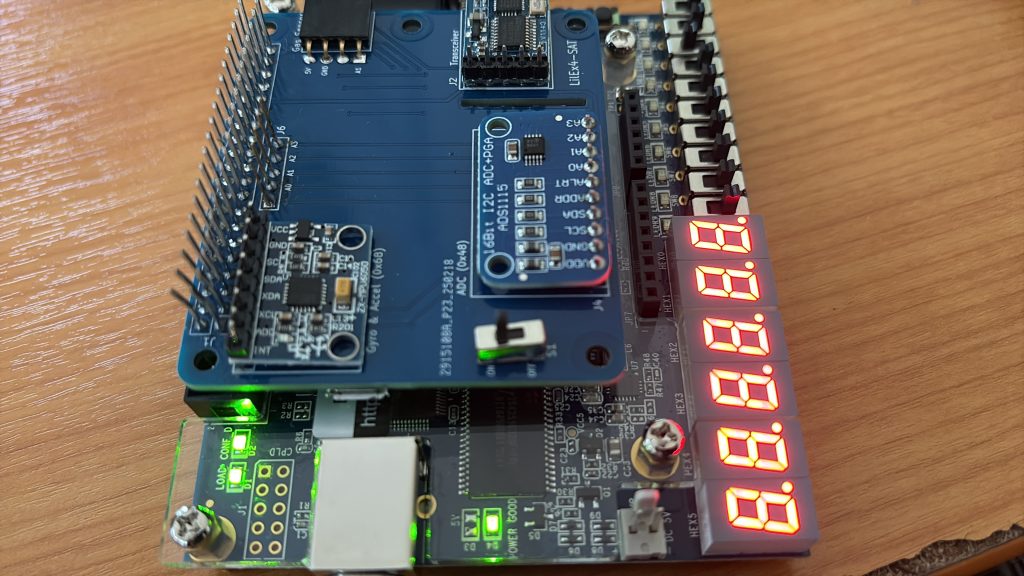
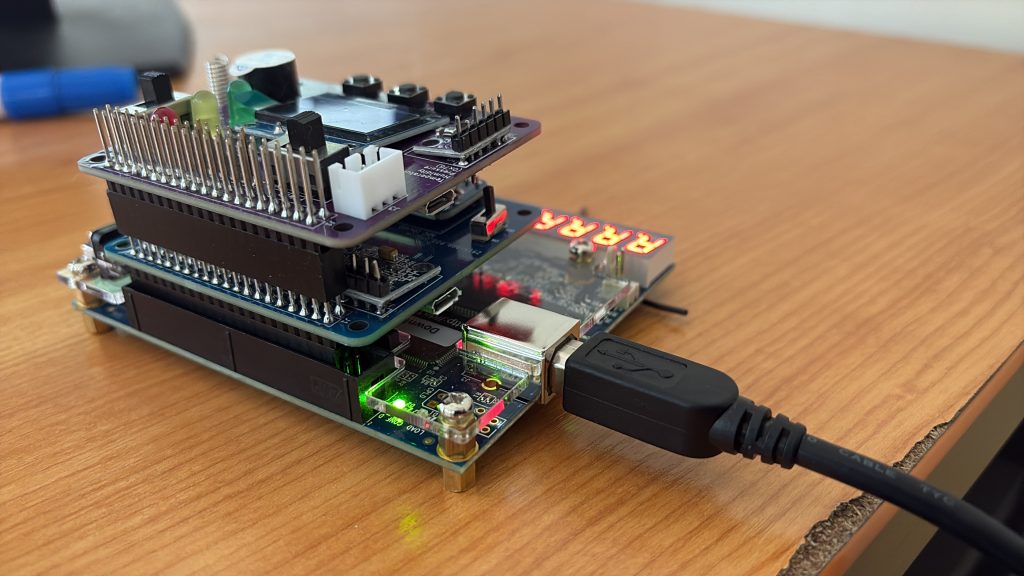
Hello my Senior Design Project (SDP) and Final Year Project (FYP) students! With a total of 7 projects—5 SDP and 2 FYP—we are diving deep into embedded systems, working with FPGA (DE10-Lite), Raspberry Pi, and Raspberry Pi Pico while integrating the UMPSA STEM Cube.
For each project, we will focus on three key objectives:
1. Developing a Functional Embedded System
-
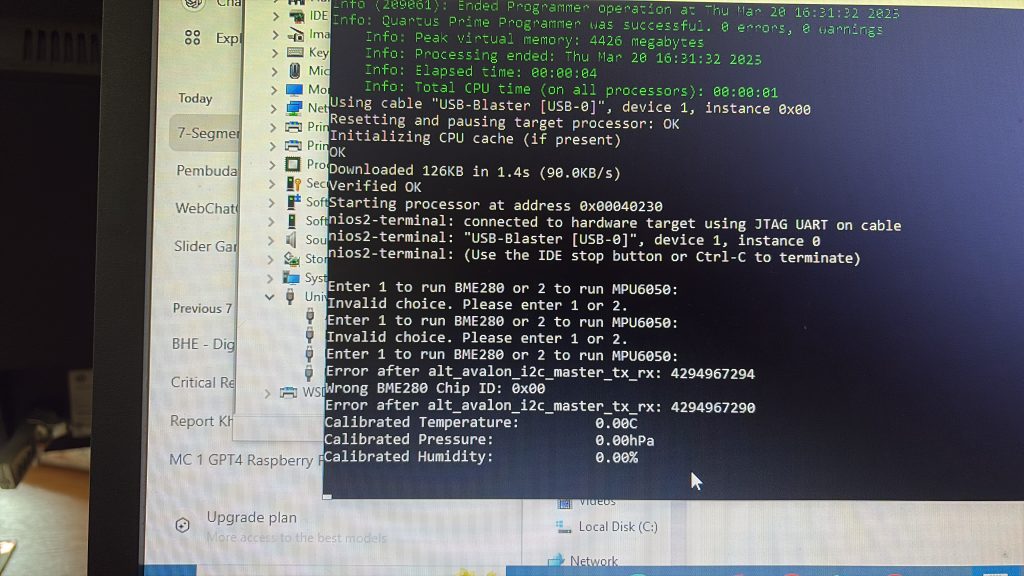
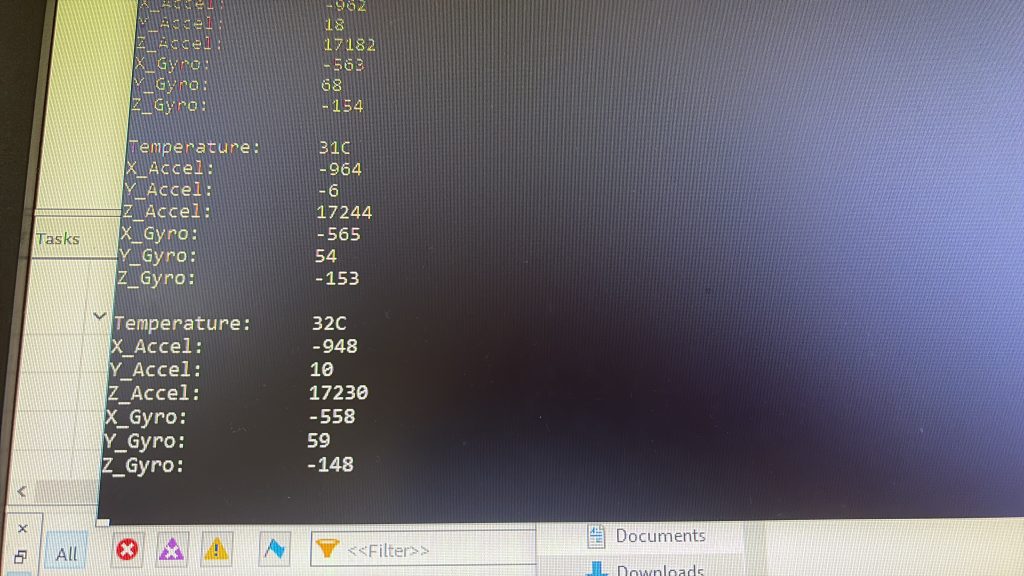
Ensuring our electronic systems can retrieve sensor data and send control signals effectively.
-
Interfacing with sensors like GPS, BME280, accelerometers, and LoRa to collect and transmit real-time data.
2. Building a Robust Logging & Database System
-
Storing sensor readings efficiently to track environmental, health, or industrial data over time.
-
Using local storage (SQLite) or cloud-based solutions (Firebase, InfluxDB, AWS IoT) depending on the project needs.
3. Creating an Interactive Dashboard for Visualization
-
Developing a user-friendly dashboard to monitor sensor data trends and alerts.
-
Utilizing platforms such as Grafana, Node-RED, Flask, or custom web interfaces for real-time visualization.
Beyond these core goals, we are taking the next step in intelligent systems by integrating predictive analytics and maintenance strategies. AI and ML algorithms will play a crucial role in making our systems smarter, more efficient, and capable of detecting anomalies before failures occur.
I am excited to be working with each of my students on these projects. Over the next two semesters, we will be designing, prototyping, testing, and optimizing our systems—bridging the gap between hardware, software, and intelligence.
This journey isn’t just about completing projects; it’s about exploring innovations in embedded systems, wireless sensor networks, and AI-driven applications. I look forward to seeing the creativity, dedication, and breakthroughs we will achieve together 🙂 !
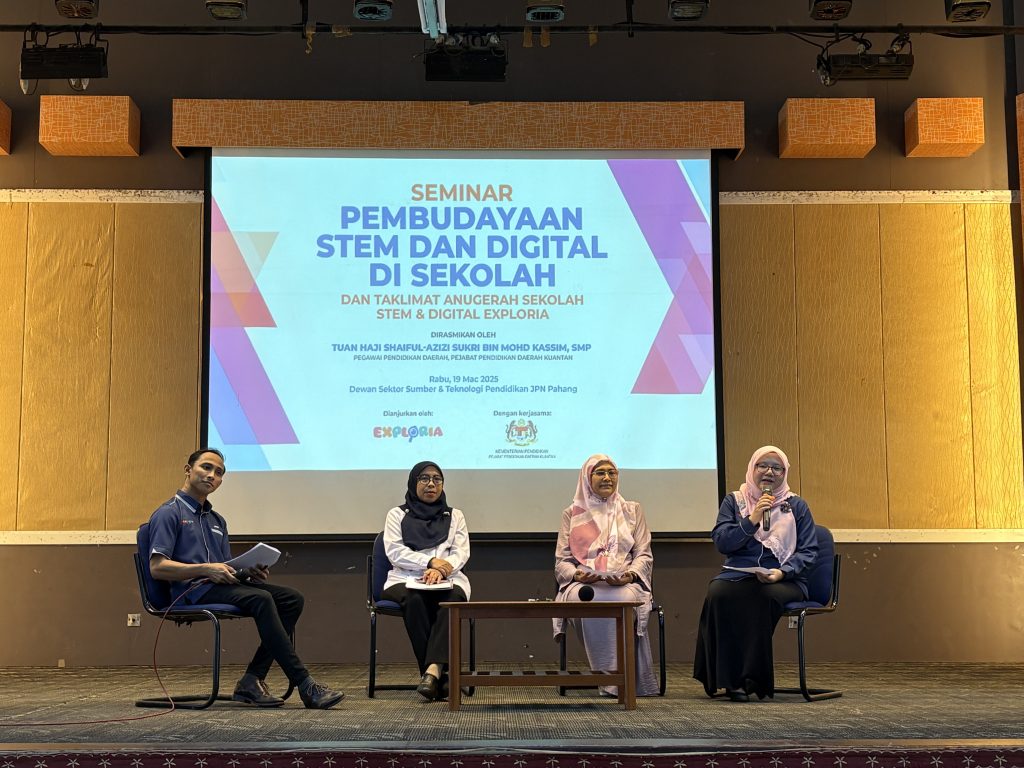
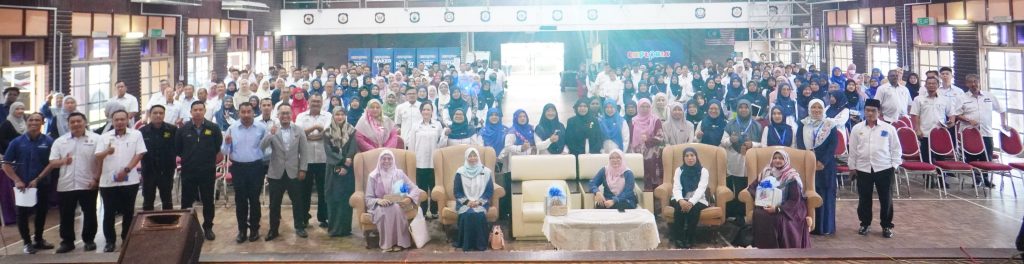
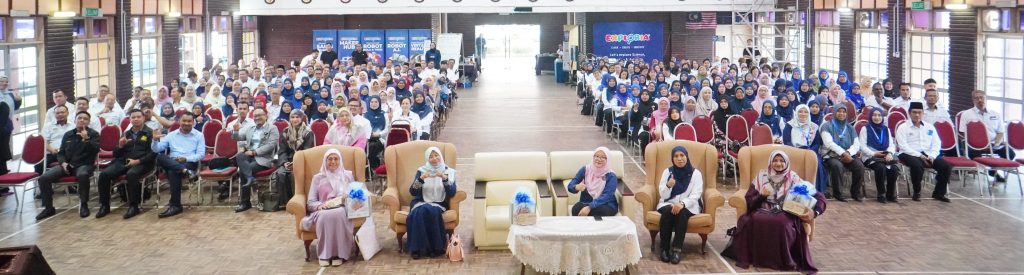
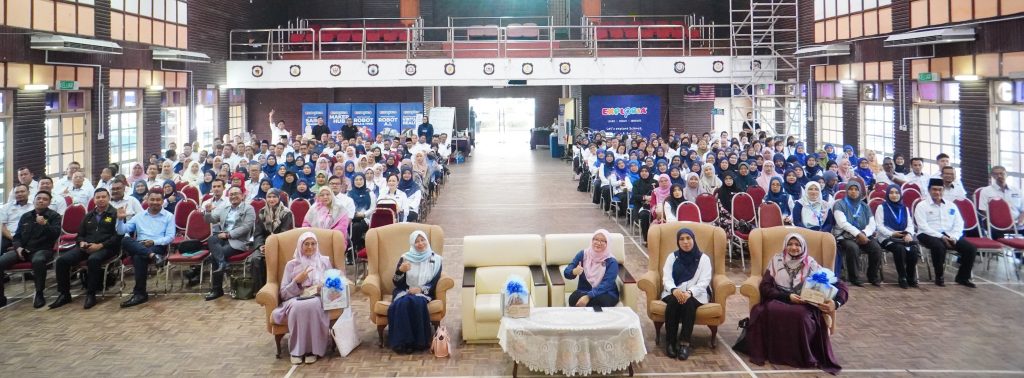
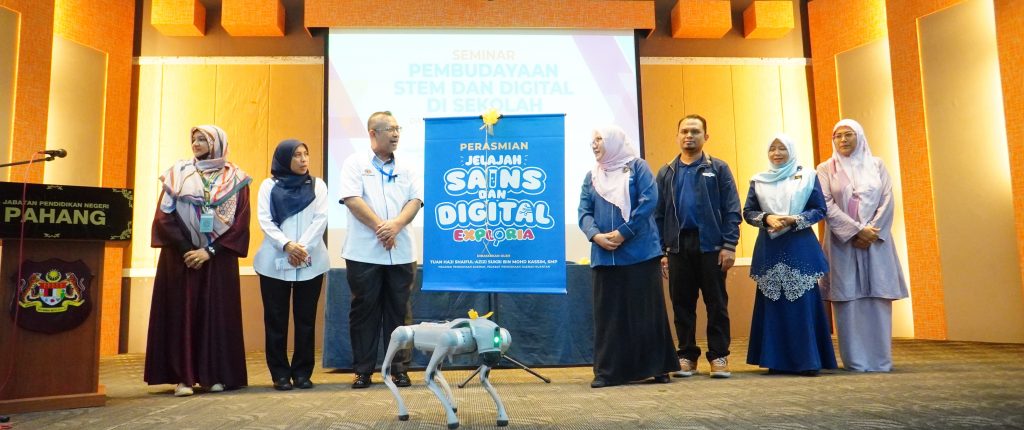
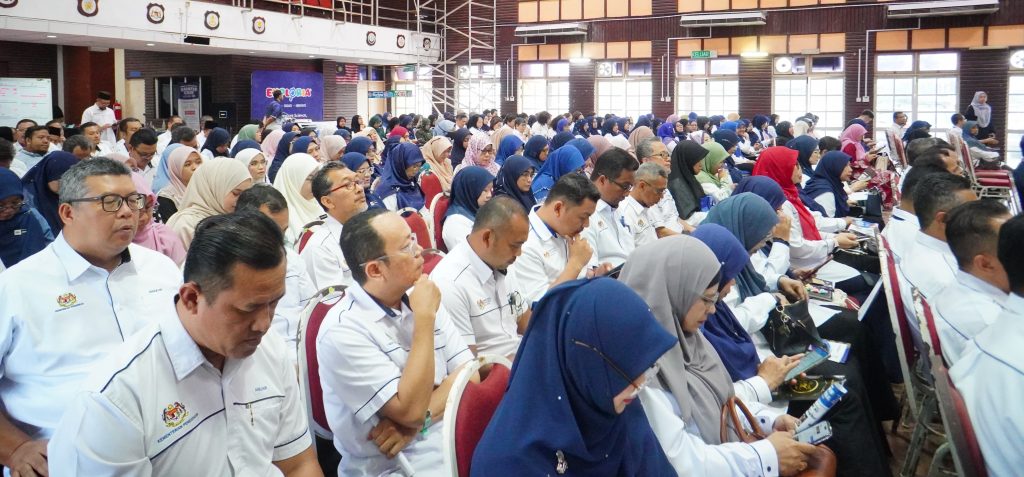
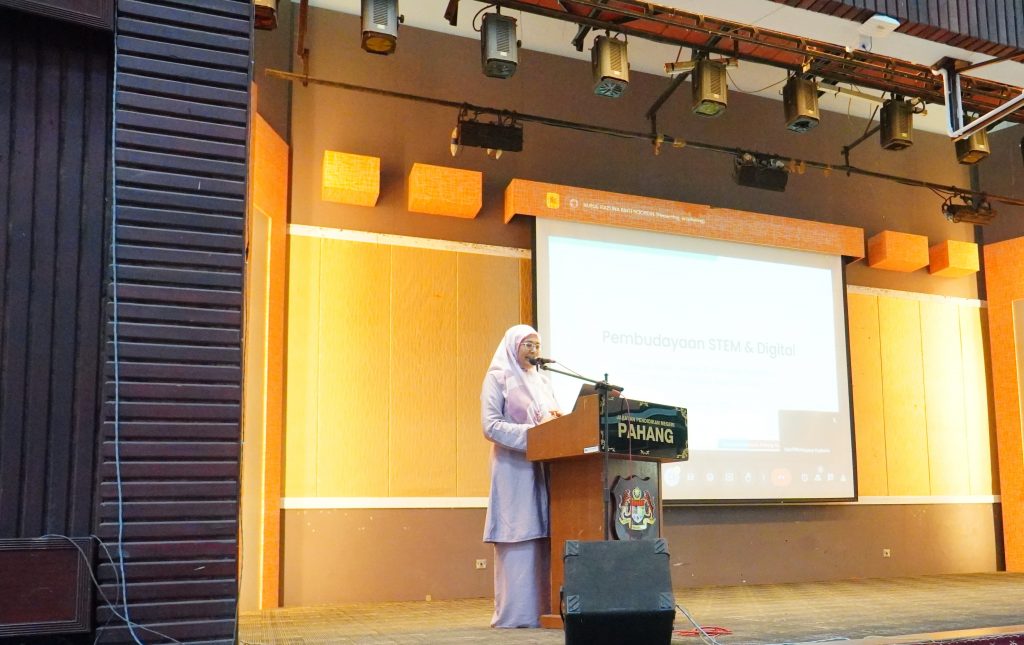
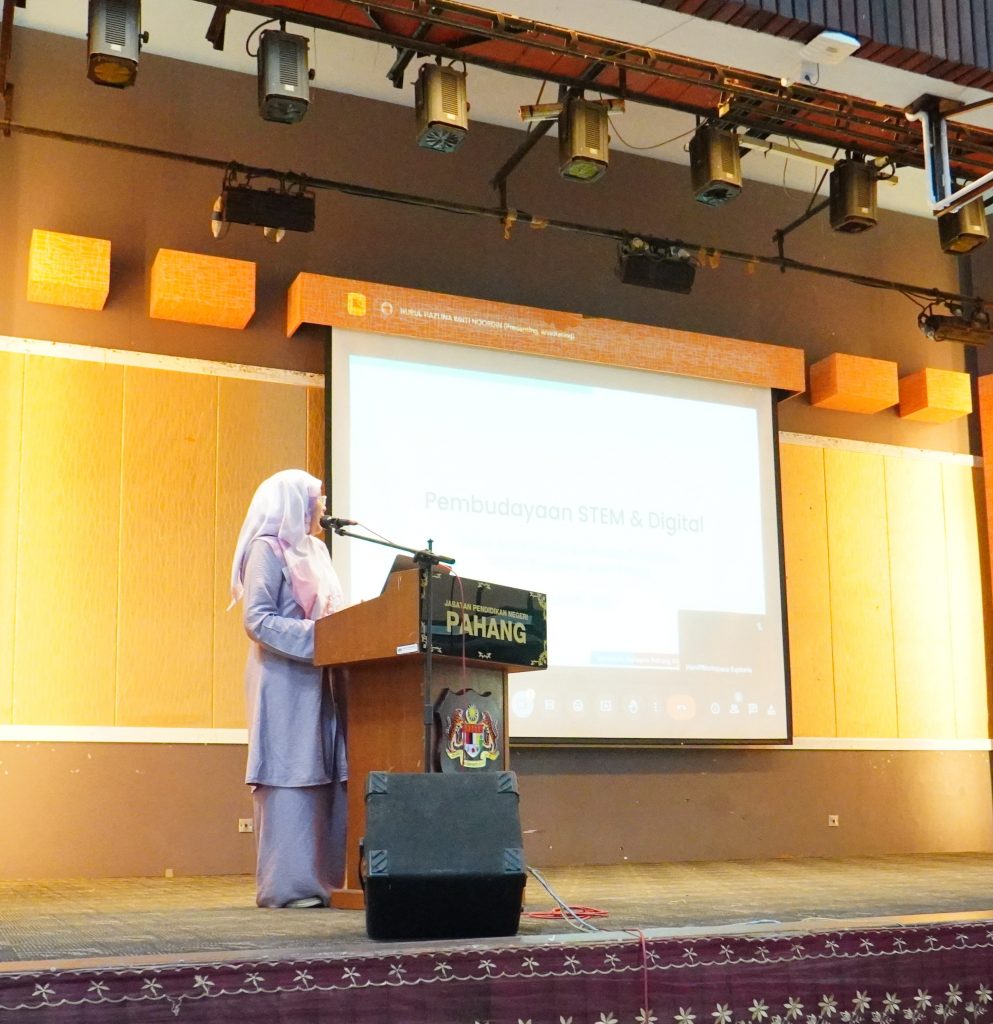
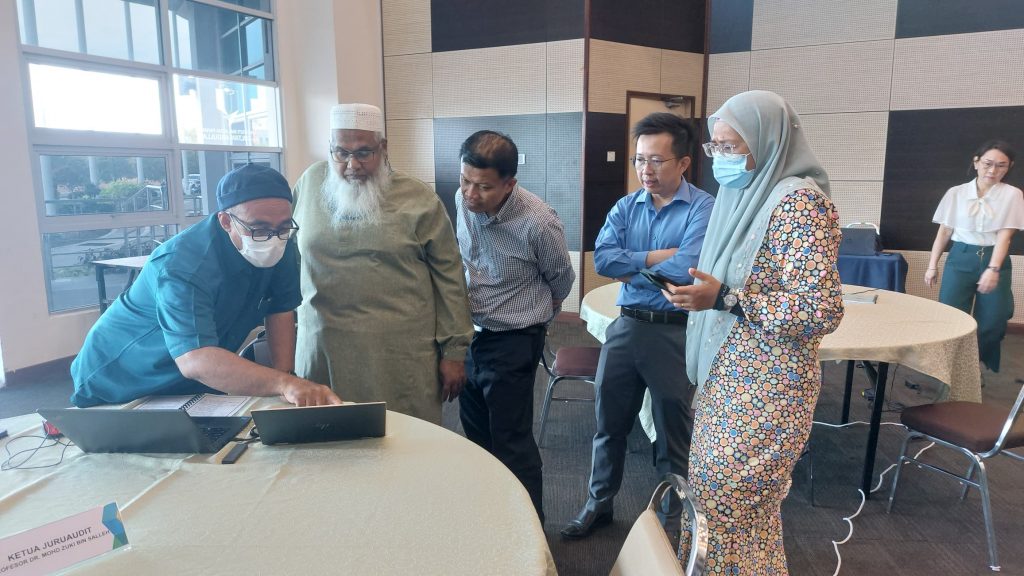
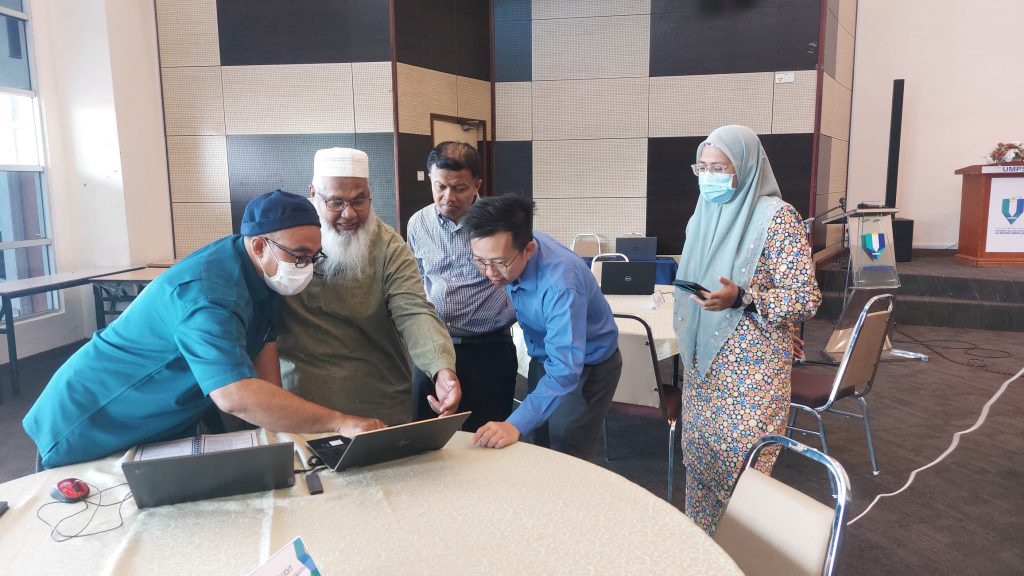
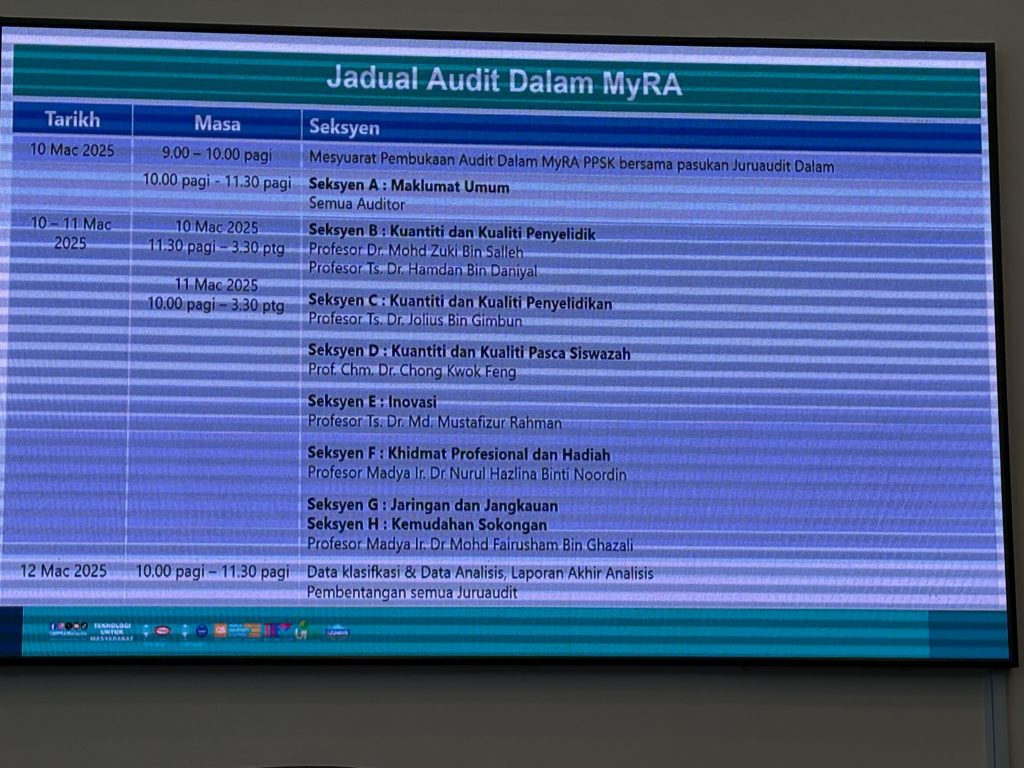
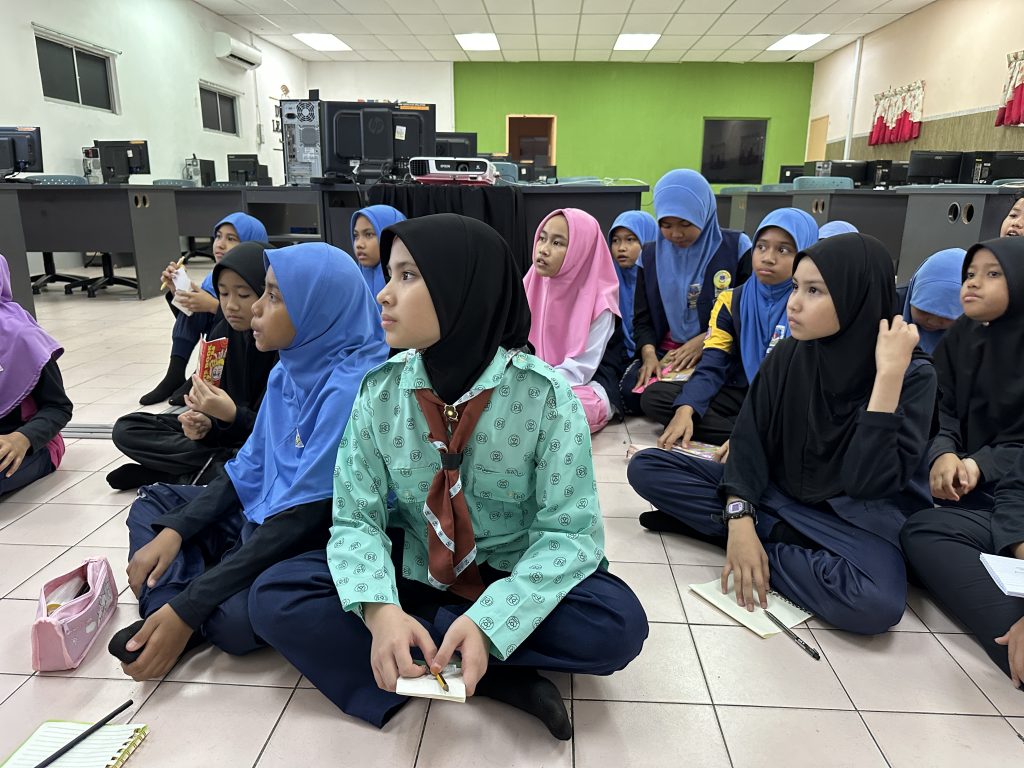
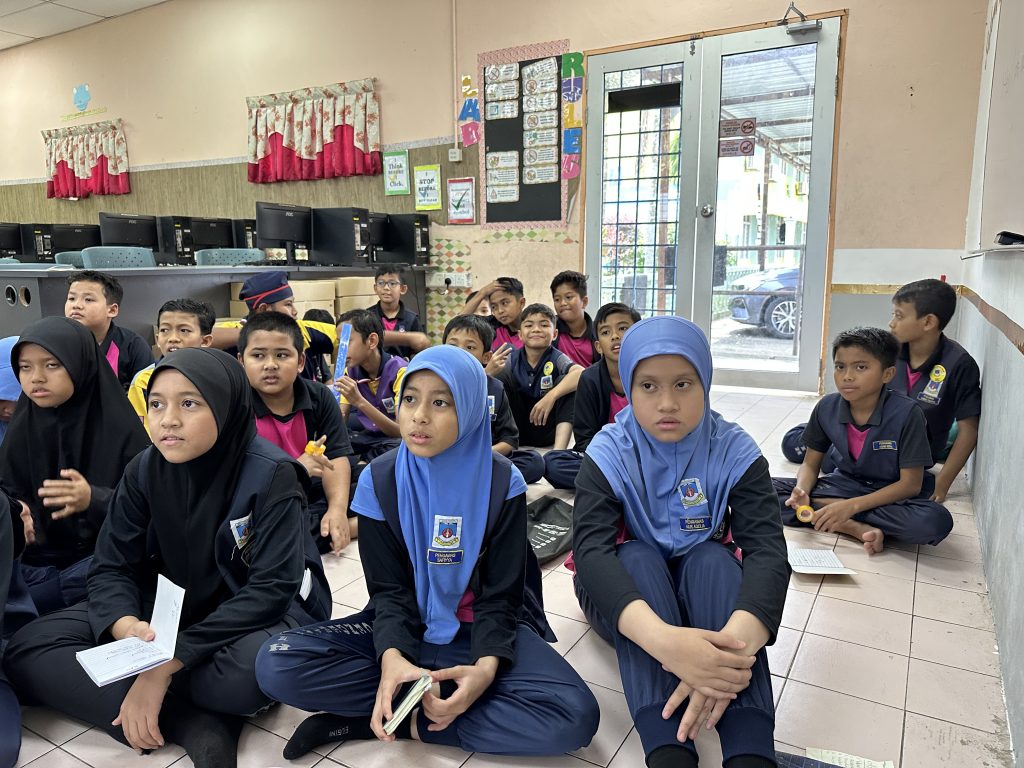
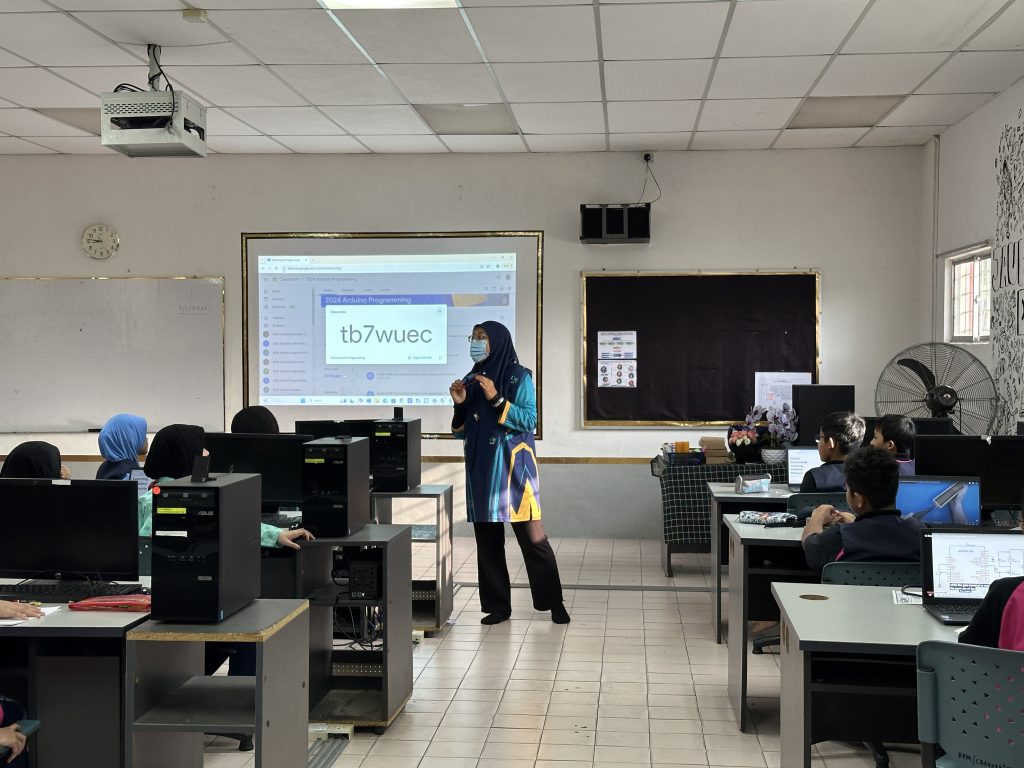
1st meeting.
Each project should focus on a specific research problem and apply different algorithms or techniques. Some possible research directions include:
| Project Theme | Focus | Potential Algorithms |
|---|---|---|
| LoRa-Based Wireless Sensor Networks | Energy-efficient WSN for long-range environmental monitoring | Kalman Filter, LSTM (Time Series Forecasting) |
| Raspberry Pi-Based Image Processing | Real-time embedded vision for industrial/environmental monitoring | YOLOv8, CNN-based object detection |
| FPGA-Based Sensor Fusion | Low-latency edge computing with FPGA and sensor fusion | Particle Filter, Sensor Fusion Algorithms |
| Predictive Maintenance for IoT Systems | AI-driven fault detection in embedded systems | LSTM, Random Forest, Anomaly Detection |
| AI-Assisted Embedded System for Health Monitoring | Wearable sensor networks with real-time AI processing | Deep Learning, Reinforcement Learning |
Define a clear problem statement for each project
Compare state-of-the-art techniques with your implementation
Collect real-world data and analyze performance metrics
Optimize power, accuracy, and efficiency of algorithms