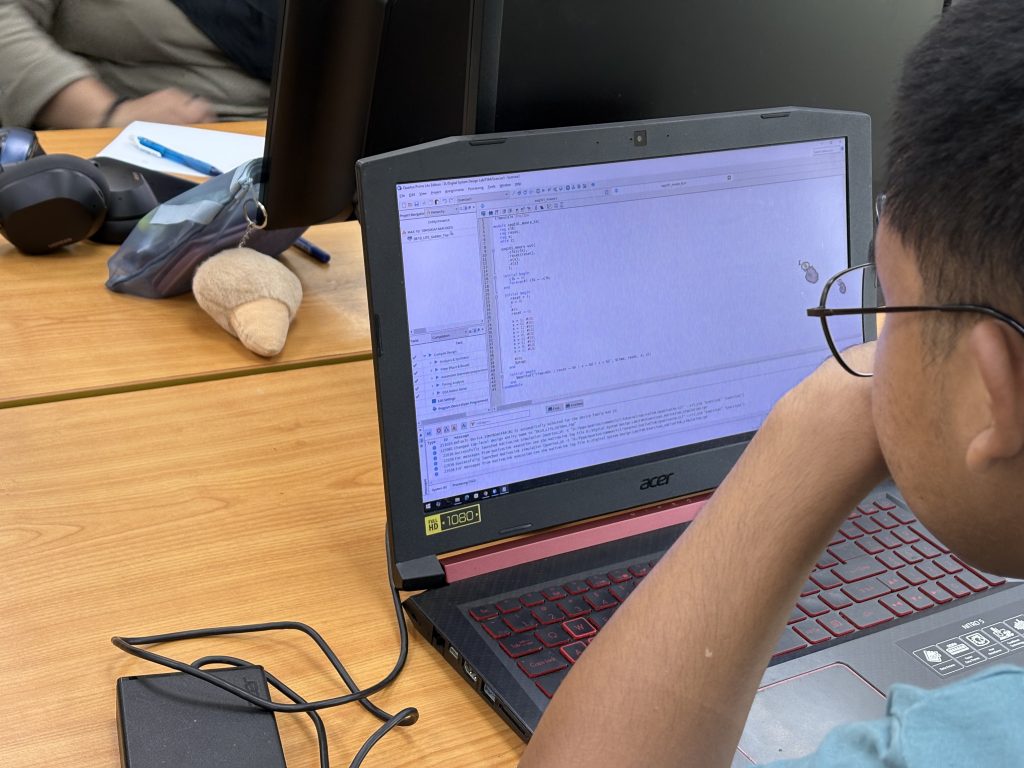
This week brought us deeper into the world of physical computing as we explored the integration of two essential sensors: the OLED SSD1306 display and the MPU6050 accelerometer-gyroscope module. This hands-on session emphasized how different devices communicate with a microcontroller, helping students solidify their understanding of communication protocols and library dependencies—two vital concepts in embedded systems development.
Part 1: Getting Started with the OLED SSD1306
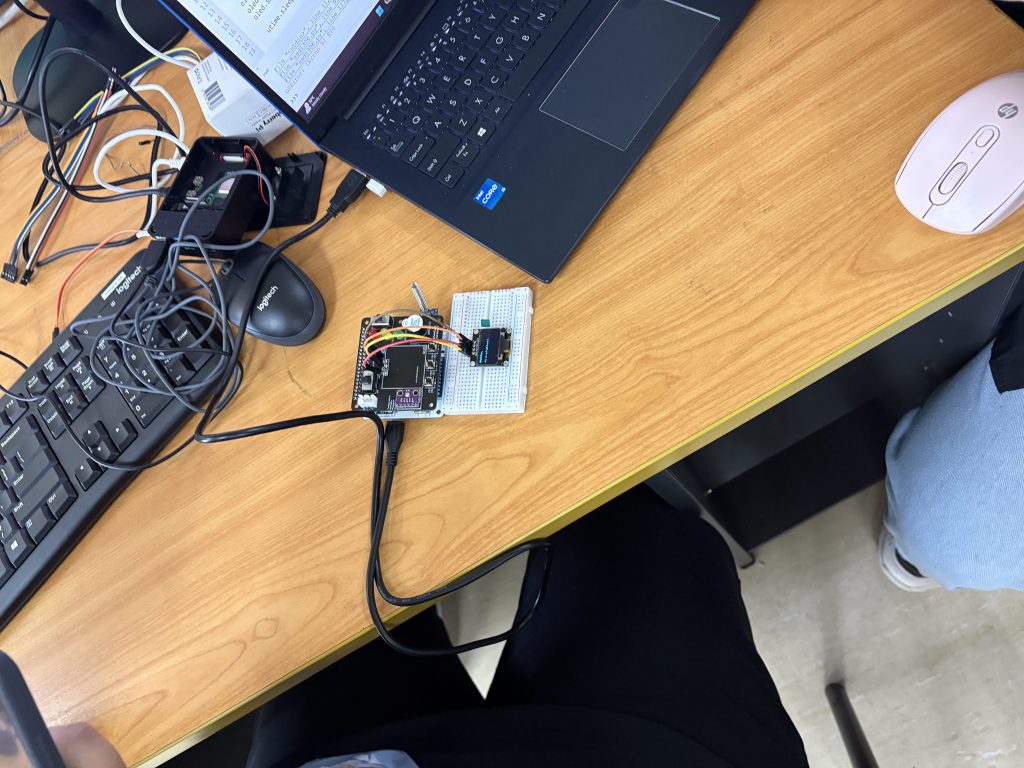
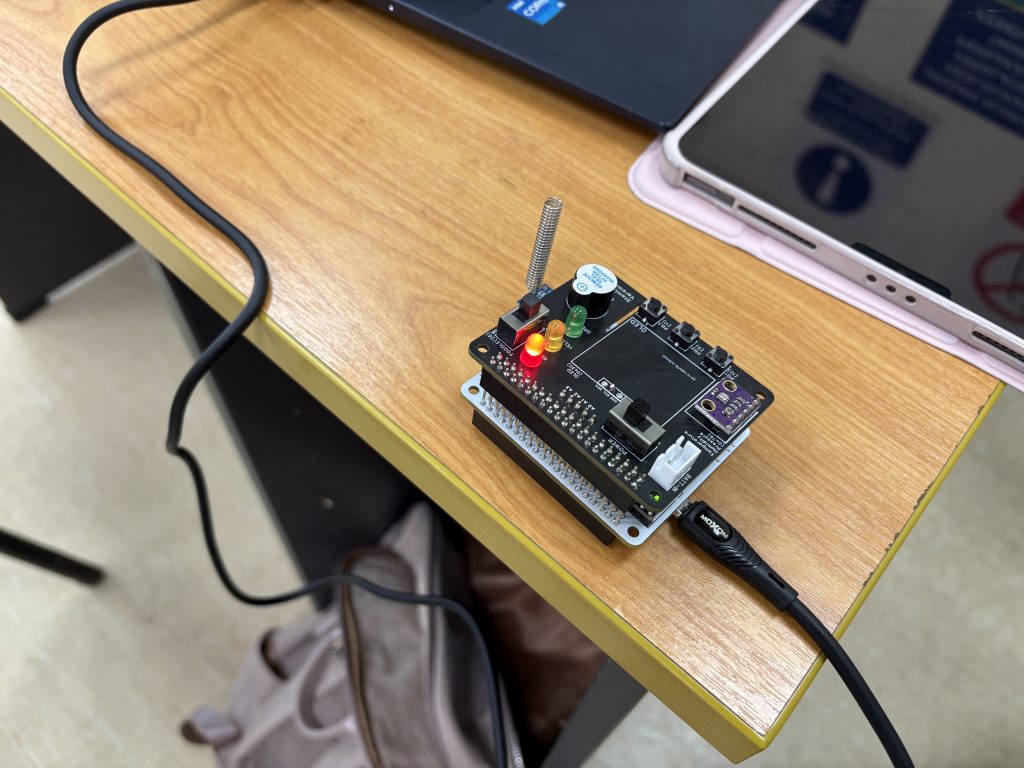
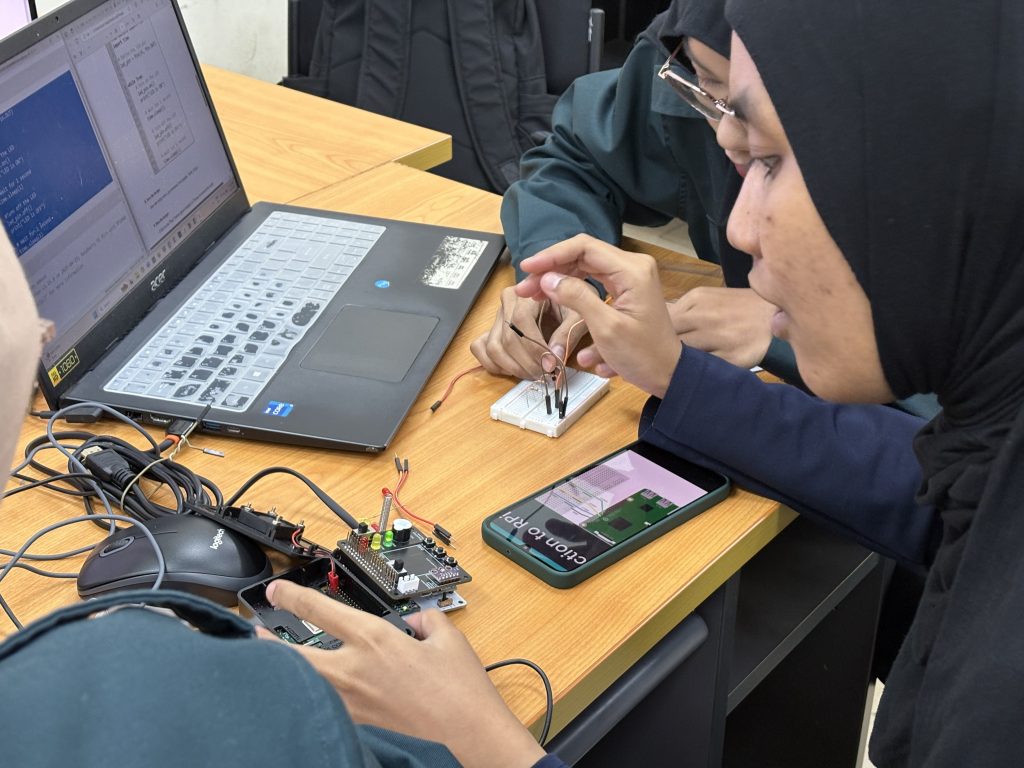
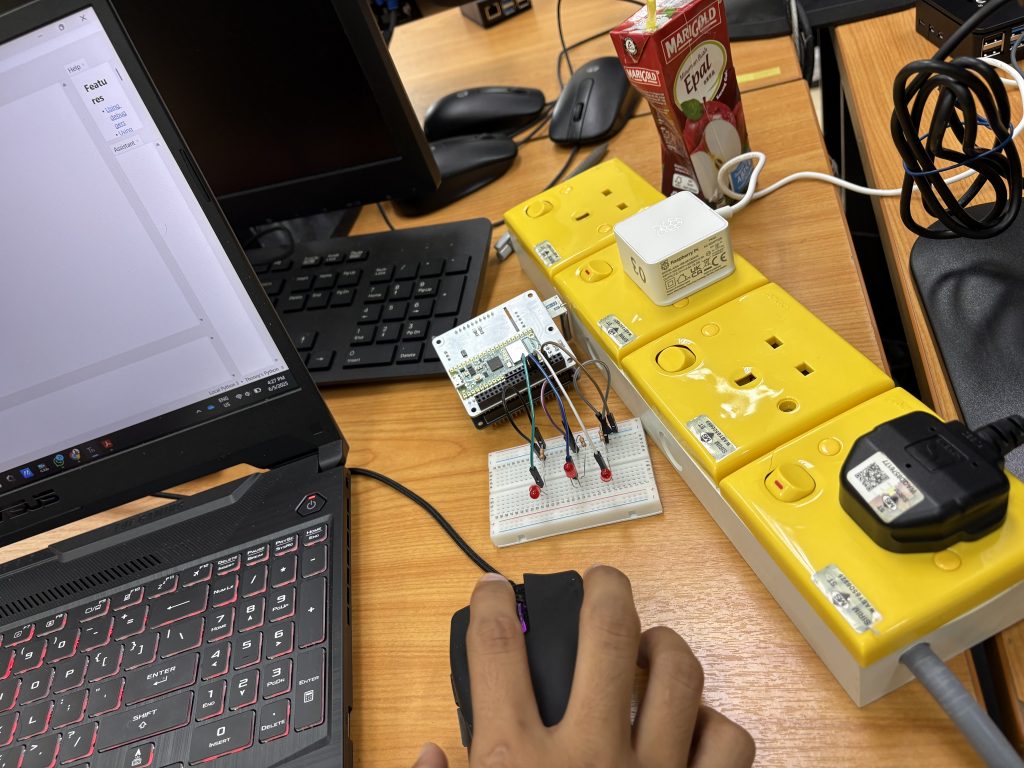
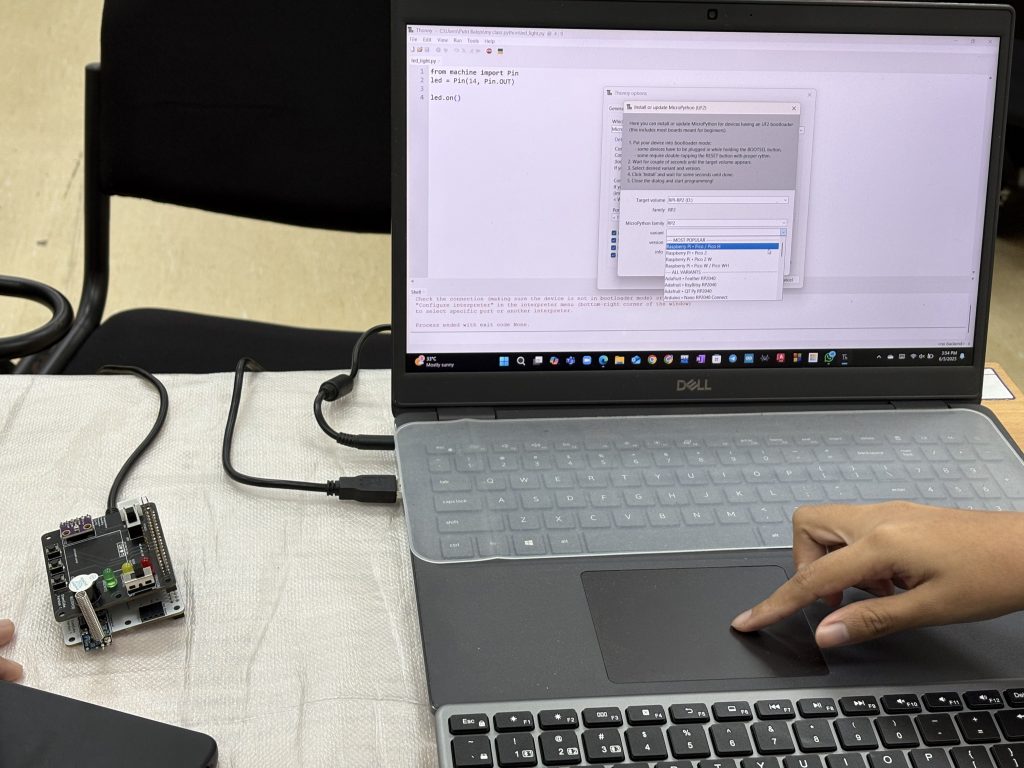
We kicked off the session by working with the OLED SSD1306, a compact I2C display module. The key learning outcomes from this segment included:
-
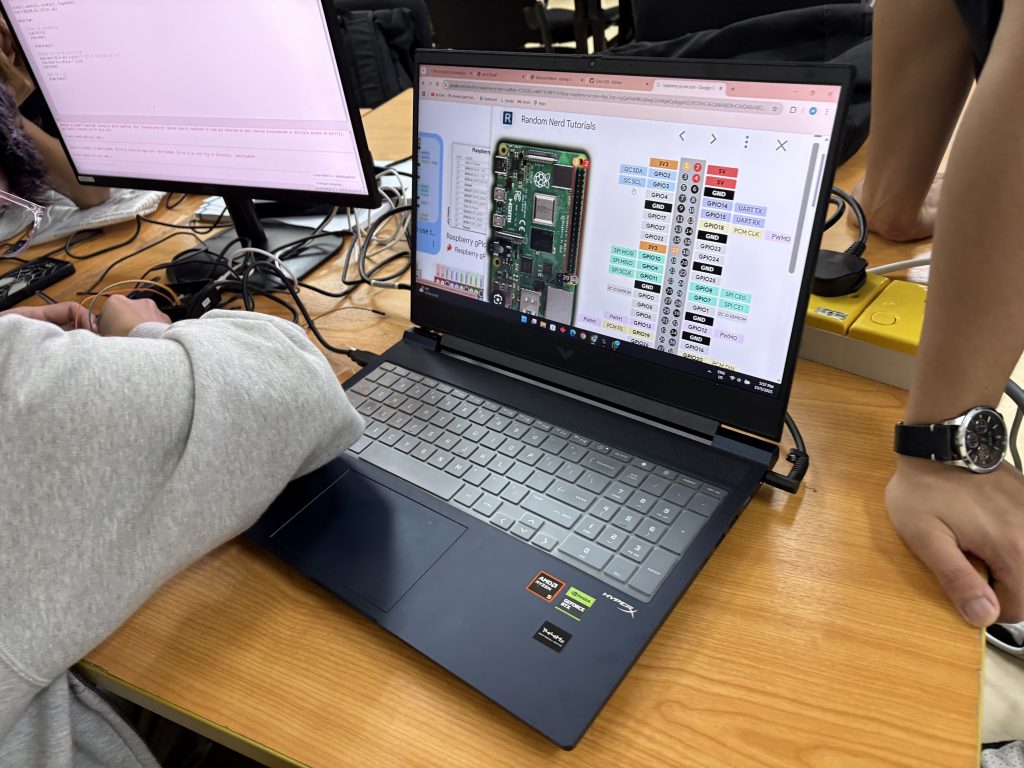
Understanding I2C protocol and how to enable it on Raspberry Pi.
-
Installing the Adafruit CircuitPython SSD1306 and Pillow libraries.
-
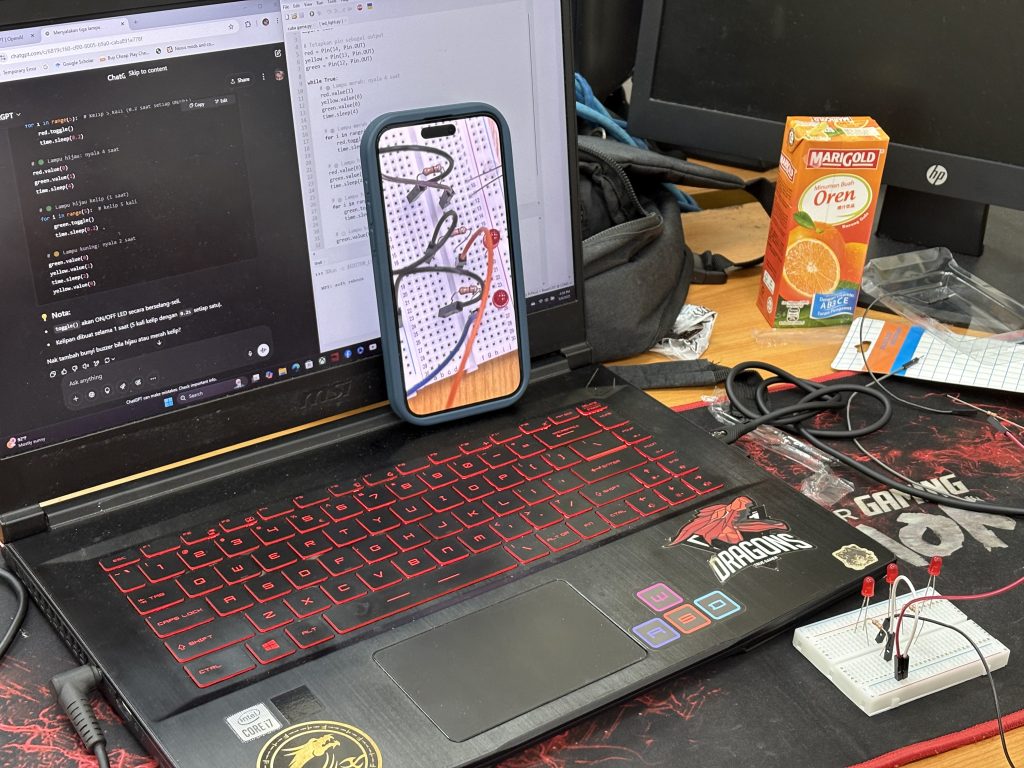
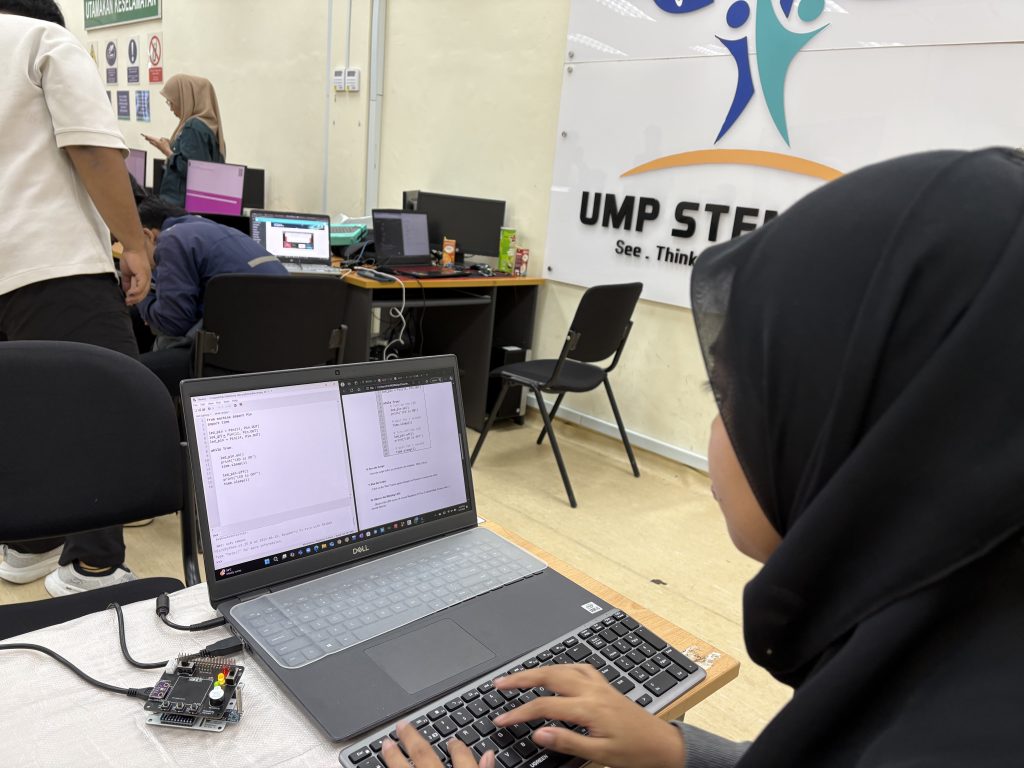
Writing and modifying Python scripts to display text such as “Hello” and “MicroPython” on the screen.
-
Recognizing how display buffers work in conjunction with ImageDraw and ImageFont.
This gave students the confidence to interact with a visual output device and understand how pixel-based rendering works in Python.
Part 2: Reading Motion Data with MPU6050
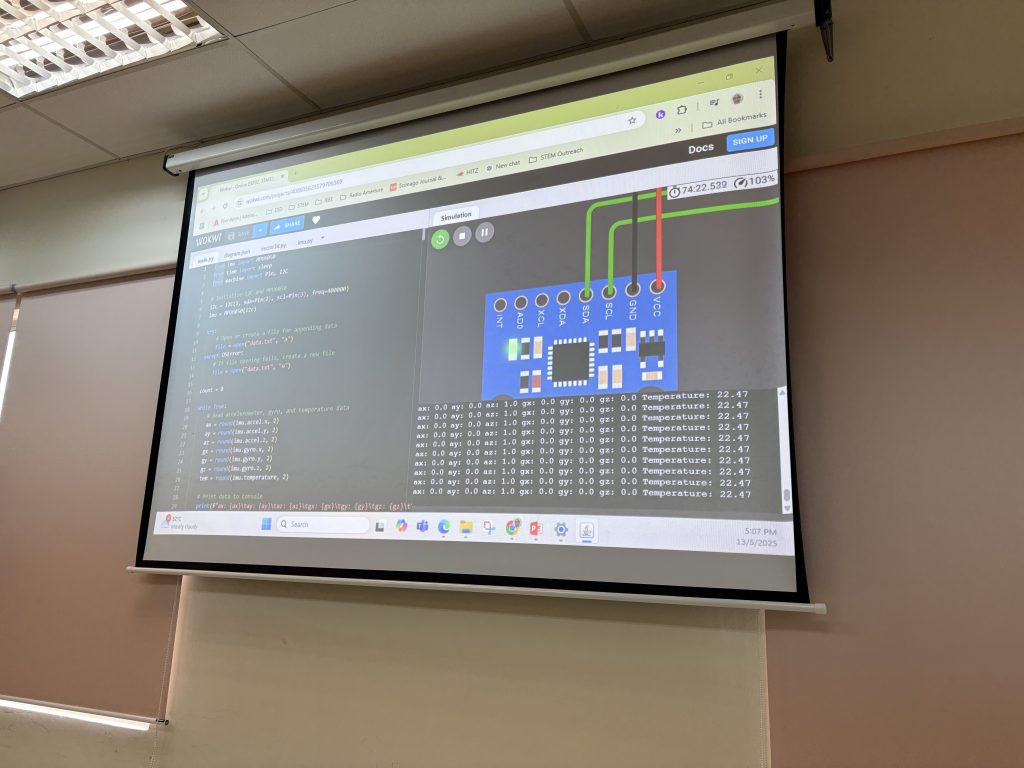
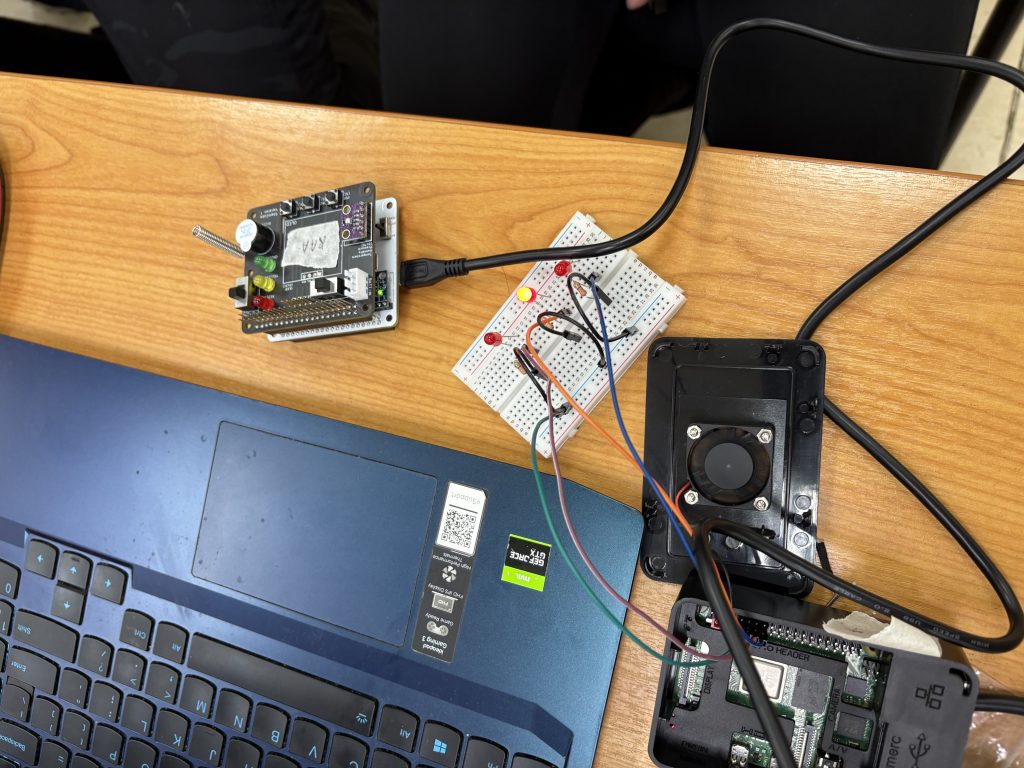
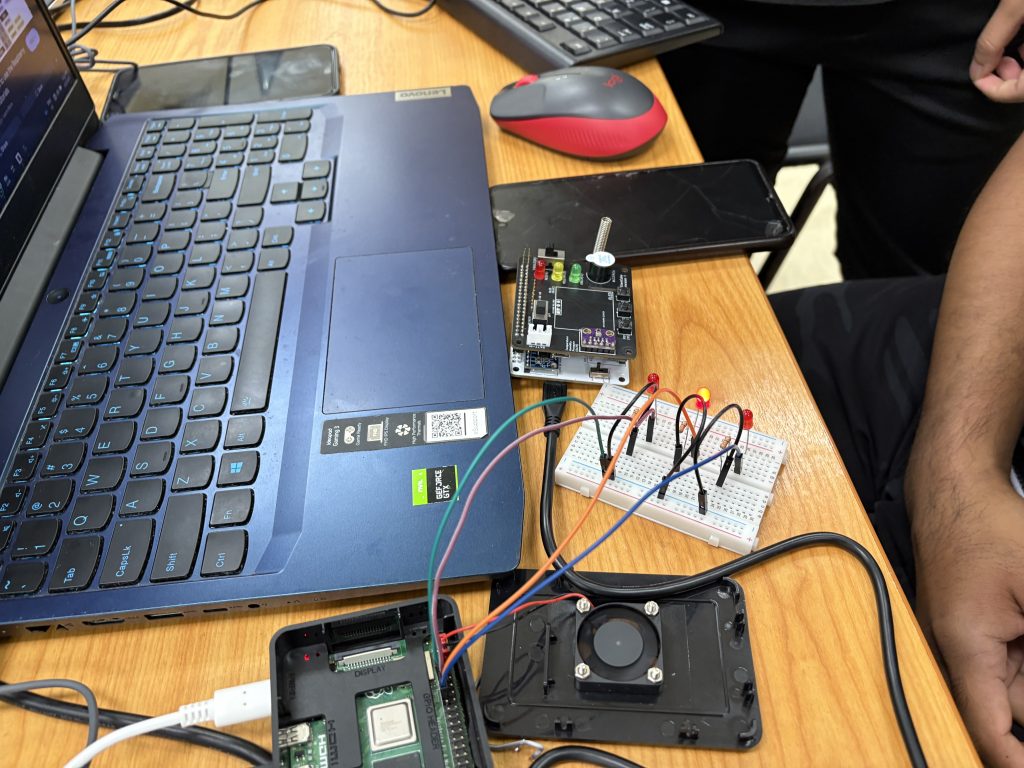
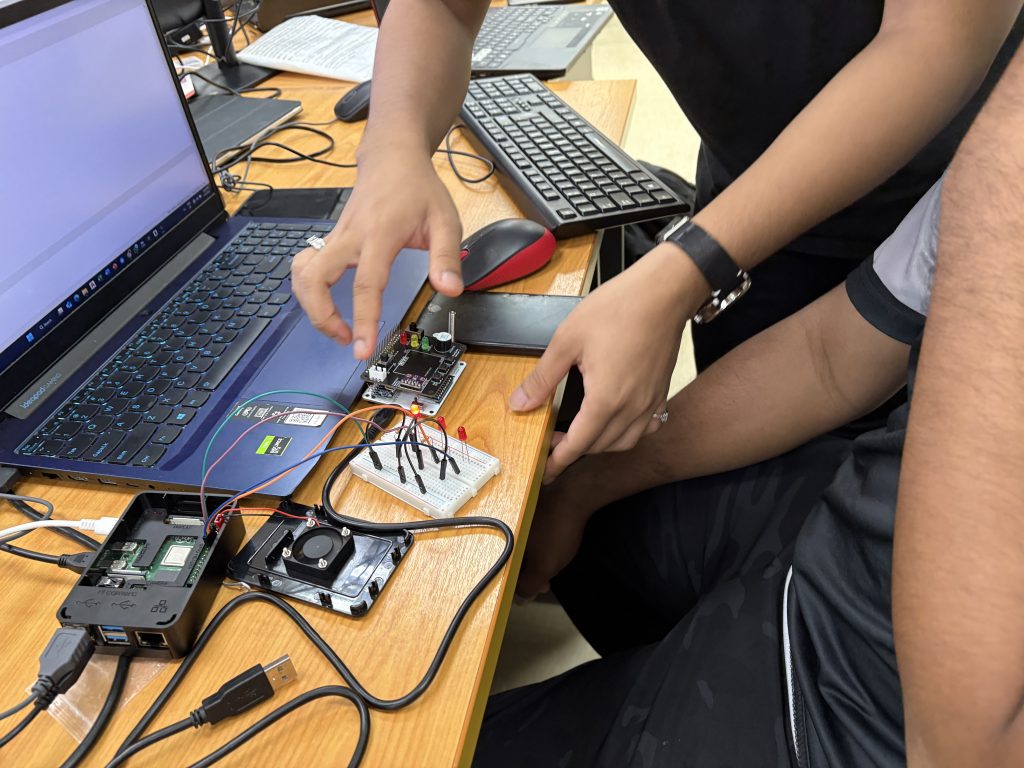
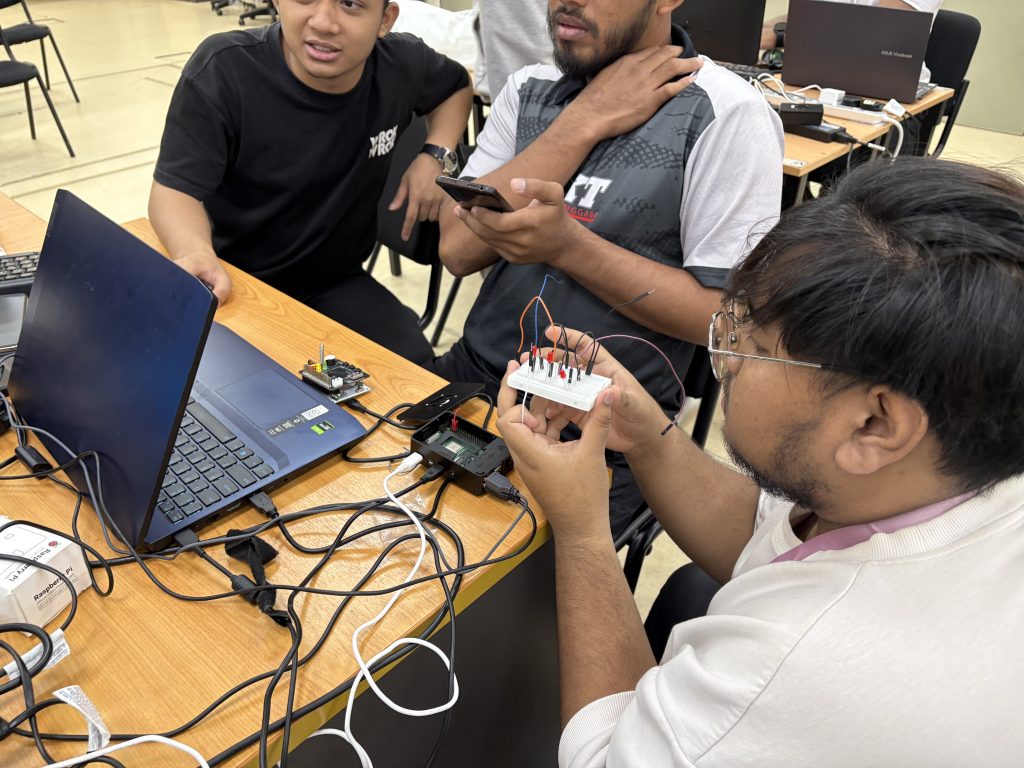
Next, we connected the MPU6050, a 6-axis motion sensor capable of detecting acceleration and angular velocity. Students worked through:
-
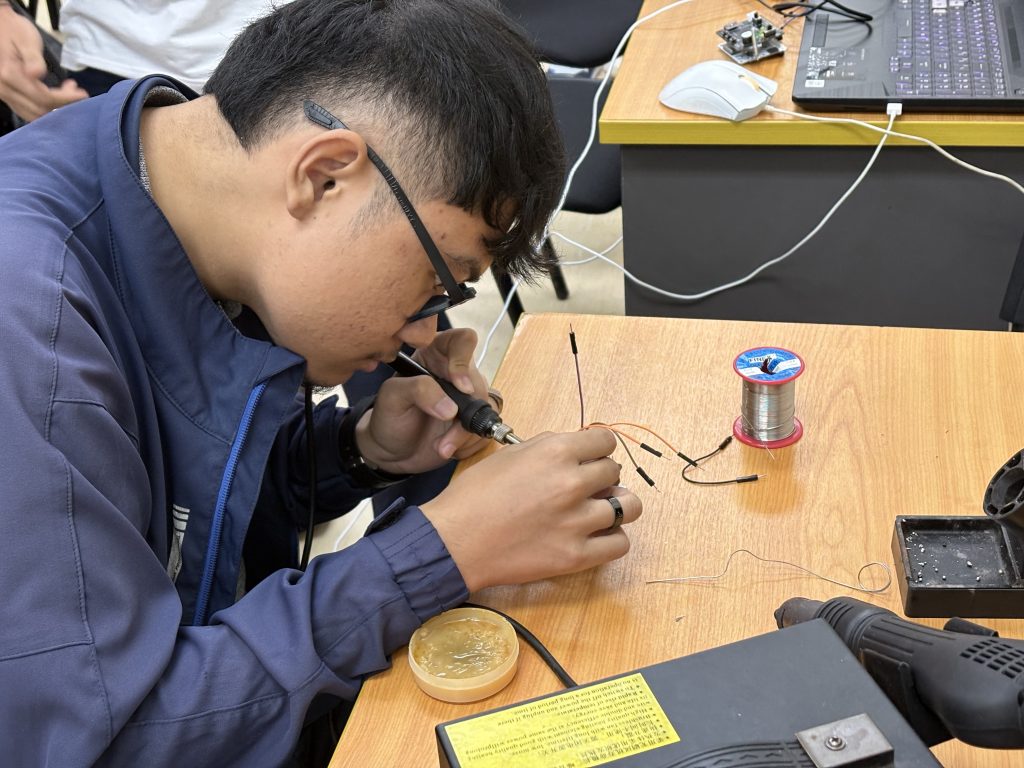
Wiring the MPU6050 module correctly using the I2C pins.
-
Installing and using the mpu6050 Python library (or equivalent like smbus and i2cdev depending on setup).
-
Writing code to retrieve:
-
3-axis accelerometer data (accel_x, accel_y, accel_z)
-
3-axis gyroscope data (gyro_x, gyro_y, gyro_z)
-
Temperature reading
This activity allowed students to appreciate how raw sensor data can be captured, processed, and used to build context-aware applications like motion-based controls or orientation tracking.
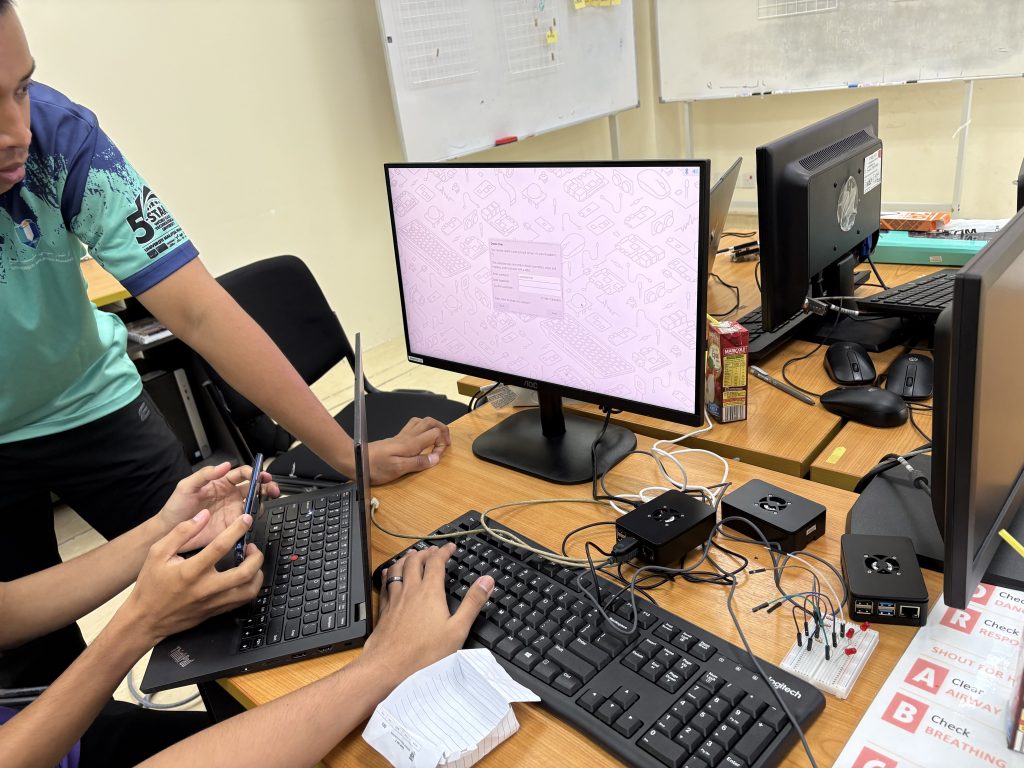
Throughout the session, students faced challenges such as installing the correct libraries, identifying I2C addresses using i2cdetect, and debugging I2C communication issues. These challenges were treated as learning opportunities that mimic real-world embedded systems development.
By the end of the class, students were able to:
-
Display custom messages on an OLED screen.
-
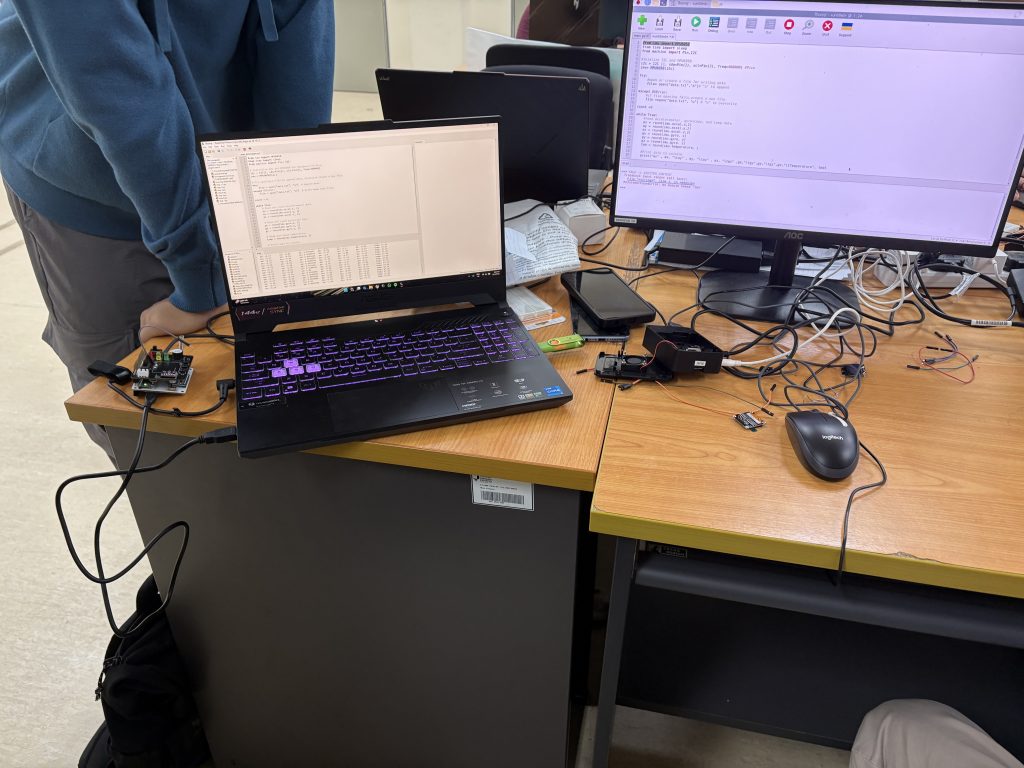
Capture and print real-time motion data from the MPU6050 sensor.
-
Understand how communication protocols (I2C) function in real applications.
-
Connect theory with practice through experiential learning.
Today’s activities not only strengthened students’ coding and hardware integration skills but also encouraged logical troubleshooting, critical thinking, and problem-solving—all key aspects of becoming a proficient developer. We’re building toward more advanced sensor-based projects in the coming weeks, and this session laid an excellent foundation.
As always, proud of the students’ persistence and teamwork as they explored and completed the activities.