The world is digital, but life is analog..


This module goes beyond traditional activities to integrate dashboard development. Building on earlier exercises involving Raspberry Pi for digital making and sensor control – Raspberry Pi IOT , the module introduces students to creating interactive and visually appealing dashboards using Python and Streamlit.
By learning how to design and deploy dashboards, students are able to transform data into actionable insights, fostering creativity and problem-solving skills. This module highlights the potential of dashboards as versatile tools for displaying and interacting with data, especially in STEM-focused projects.

Bridging Digital Making and Dashboards
Earlier modules focused on digital making with Raspberry Pi, where students controlled sensors and engaged in hands-on programming. This practical experience focuses on understanding data collection and manipulation. The next logical step was to showcase this data meaningfully—enter dashboard development.

While third-party platforms like Blynk or Adafruit IO offer straightforward solutions for creating dashboards, their limitations in customization and scalability inspired us to introduce Streamlit. This open-source Python framework allows students to design dashboards with unmatched flexibility and creativity.

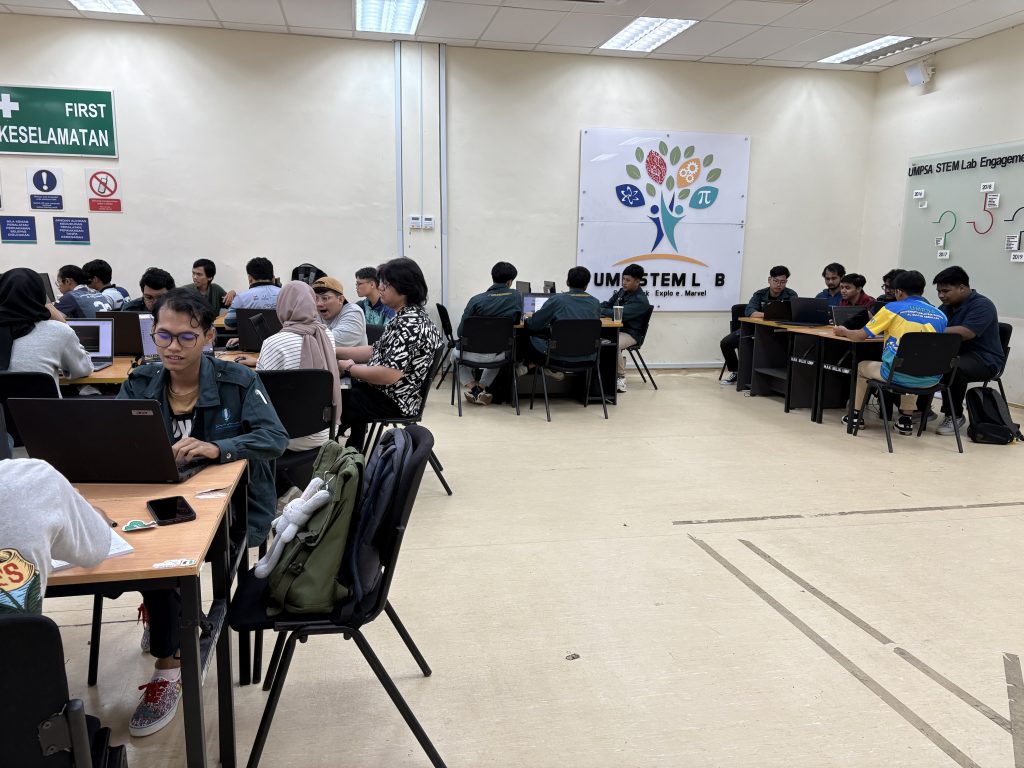
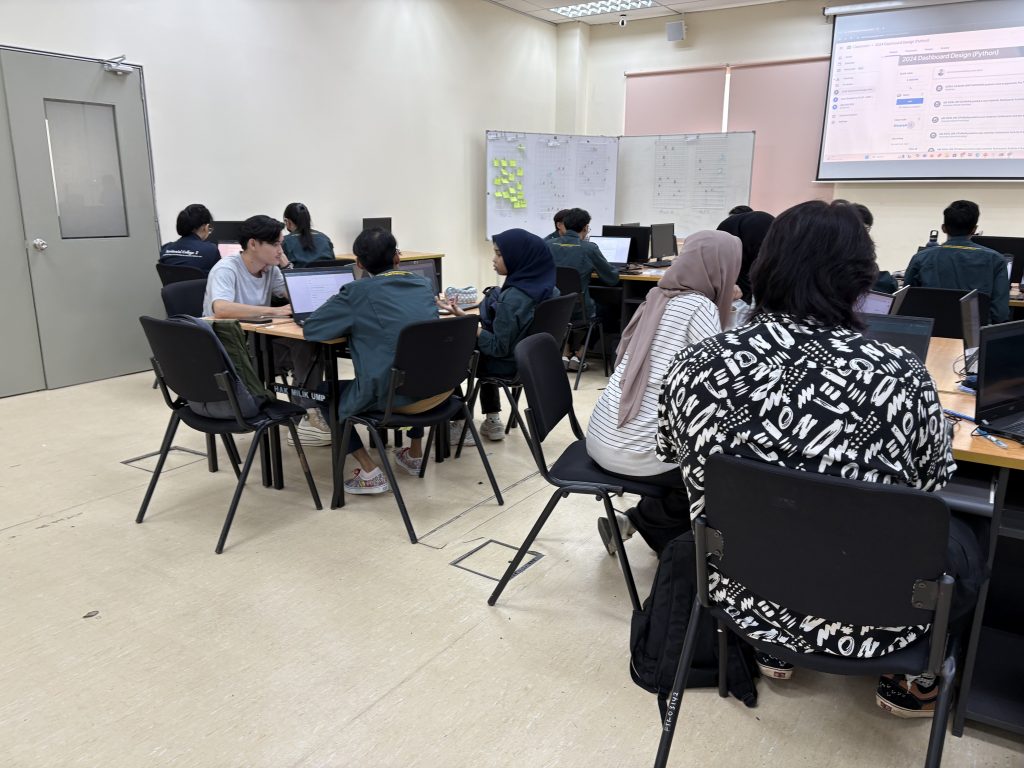
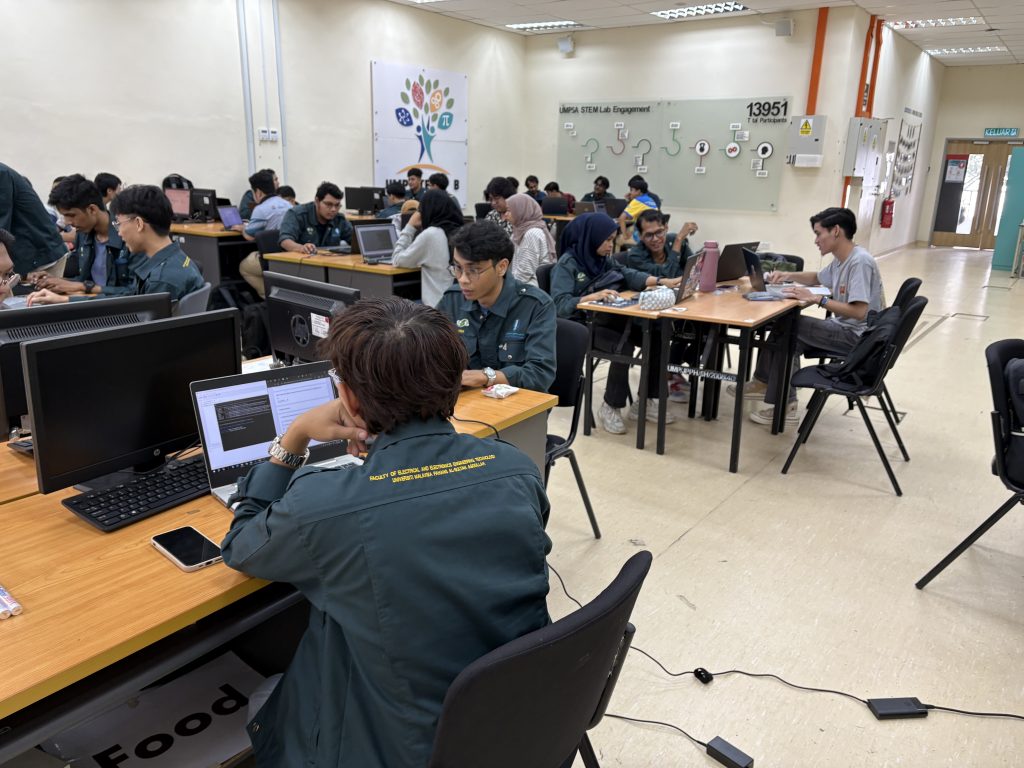
Activities in the Dashboard Development Module


Creative Potential with Streamlit
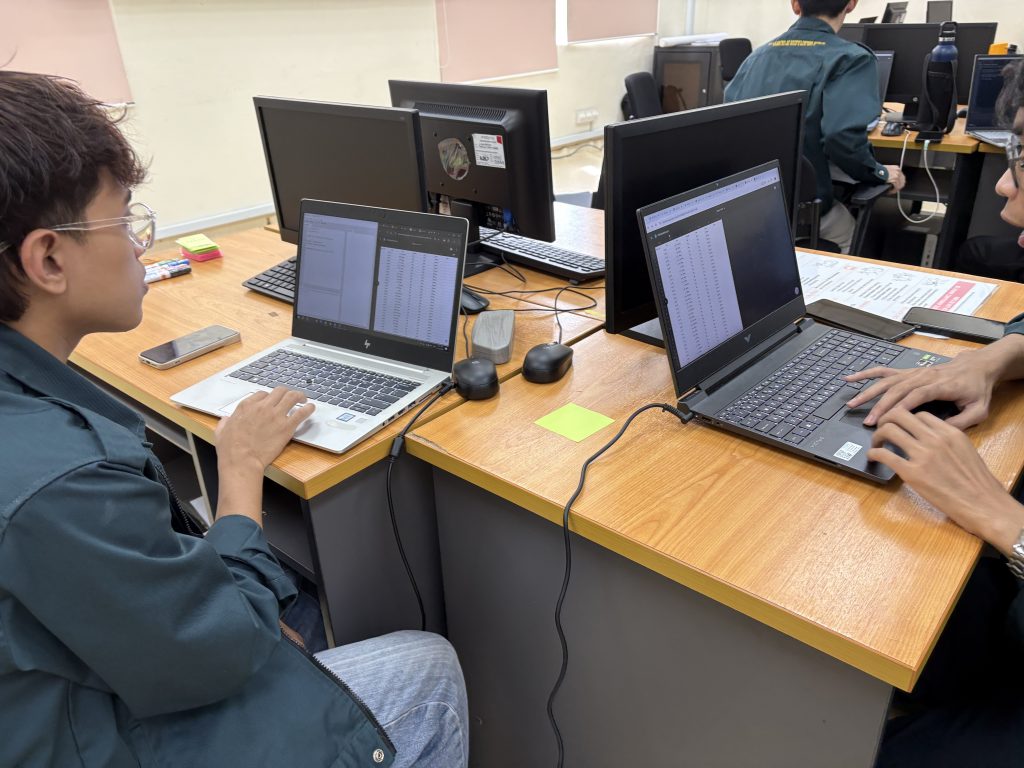
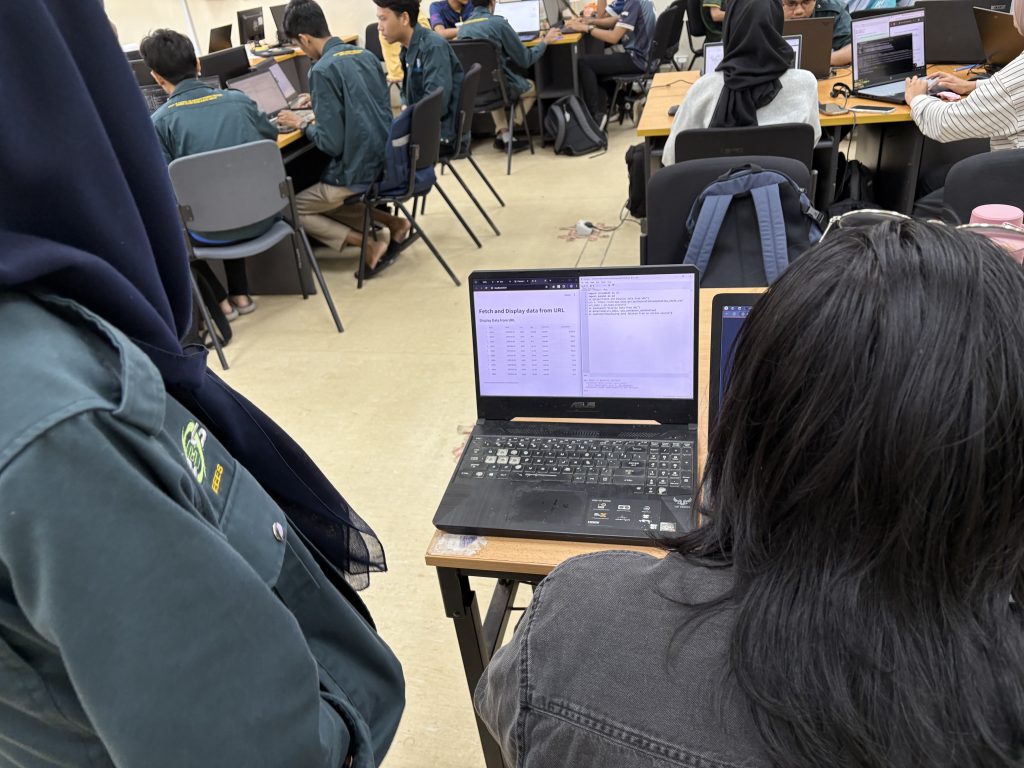
Streamlit’s ability to integrate seamlessly with Python makes it a good platform for fostering creativity. Students are no longer confined to pre-built templates, as they can create dashboards tailored to specific needs, whether it’s monitoring environmental sensors, visualizing IoT data, or developing educational tools.
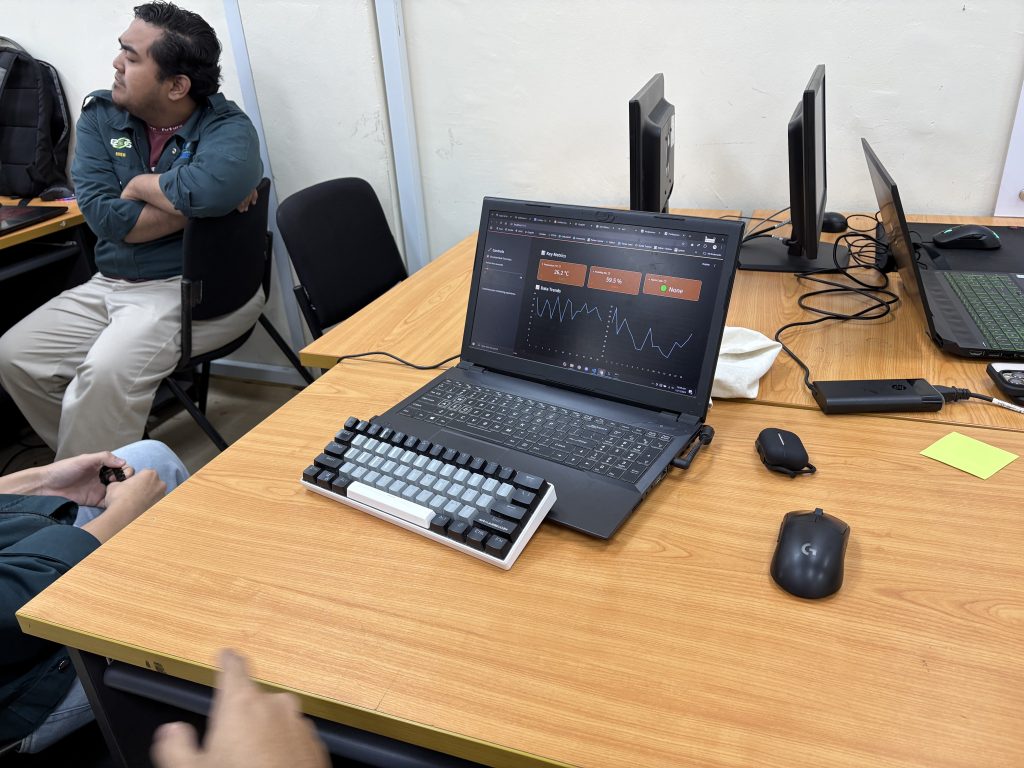
For instance, a student could design a dashboard that tracks temperature and humidity data collected from Raspberry Pi sensors. The dashboard could display real-time graphs, provide historical comparisons, and even allow users to set alerts—all features that Blynk or Adafruit might limit due to platform constraints.

Expanding Horizons in STEM Education
This dashboard module aligns with the broader goal of empowering students to think critically and creatively in the digital age. By mastering tools like Streamlit, students can transition from passive consumers of technology to active creators, capable of solving real-world problems.
Dashboard development is more than just a technical skill – it’s a gateway to exploring how data shapes decisions in diverse fields, from agriculture to healthcare. Combined with their experience in digital making, students are well-equipped to lead the way in the era of IoT and data-driven solutions.
The integration of Streamlit in our educational modules bridges the gap between data collection and presentation, offering students the tools to develop bespoke dashboards. Unlike third-party platforms, Streamlit encourages limitless creativity, making it the ideal choice for empowering the next generation of innovators.
This week we ventured beyond traditional activities to integrate dashboard development. Building on earlier exercises involving Raspberry Pi for digital making and sensor control (Week 5 – 8), this module introduces students to creating interactive and visually appealing dashboards using Python and Streamlit.
By learning how to design and deploy dashboards, students are able to transform data into actionable insights, fostering creativity and problem-solving skills. This module highlights the potential of dashboards as versatile tools for displaying and interacting with data, especially in STEM-focused projects.
Bridging Digital Making and Dashboards
Earlier modules focused on digital making with Raspberry Pi, where students controlled sensors and engaged in hands-on programming. This practical experience focuses on understanding data collection and manipulation. The next logical step was to showcase this data meaningfully—enter dashboard development.
While third-party platforms like Blynk or Adafruit IO offer straightforward solutions for creating dashboards, their limitations in customization and scalability inspired us to introduce Streamlit. This open-source Python framework allows students to design dashboards with unmatched flexibility and creativity.
Activities in the Dashboard Development Module
Creative Potential with Streamlit
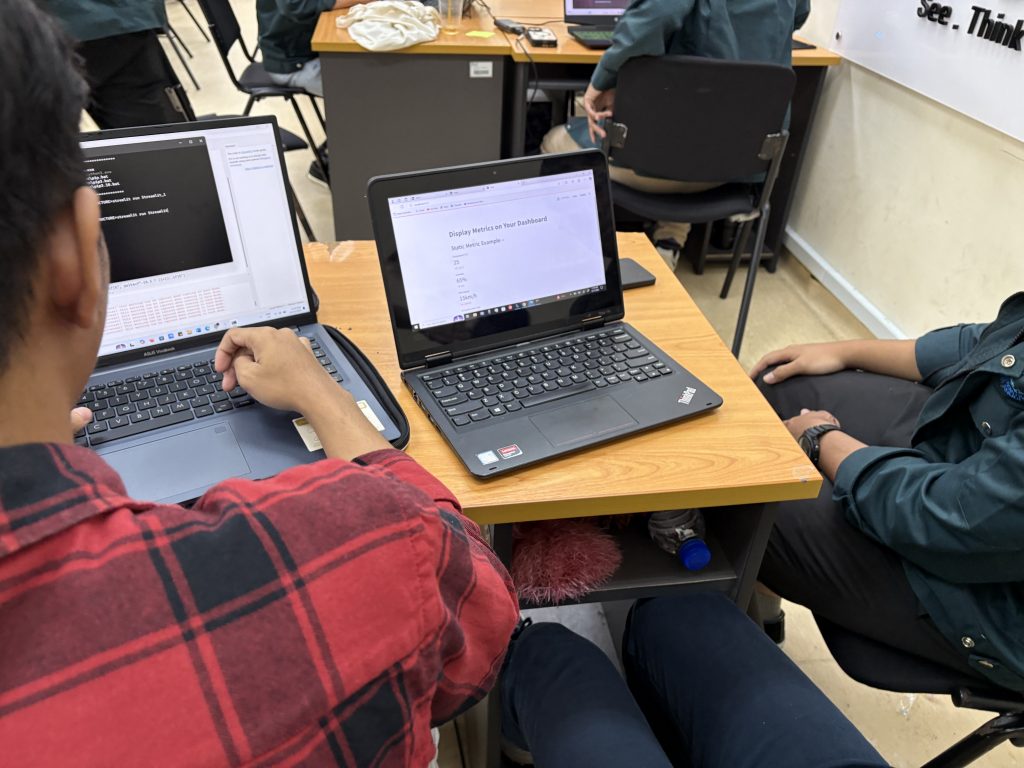
Streamlit’s ability to integrate seamlessly with Python makes it a good platform for fostering creativity. Students are no longer confined to pre-built templates, as they can create dashboards tailored to specific needs, whether it’s monitoring environmental sensors, visualizing IoT data, or developing educational tools.
For instance, a student could design a dashboard that tracks temperature and humidity data collected from Raspberry Pi sensors. The dashboard could display real-time graphs, provide historical comparisons, and even allow users to set alerts—all features that Blynk or Adafruit might limit due to platform constraints.
Expanding Horizons in STEM Education
This dashboard module aligns with the broader goal of empowering students to think critically and creatively in the digital age. By mastering tools like Streamlit, students can transition from passive consumers of technology to active creators, capable of solving real-world problems.
Dashboard development is more than just a technical skill – it’s a gateway to exploring how data shapes decisions in diverse fields, from agriculture to healthcare. Combined with their experience in digital making, students are well-equipped to lead the way in the era of IoT and data-driven solutions.
The integration of Streamlit in our educational modules bridges the gap between data collection and presentation, offering students the tools to develop bespoke dashboards. Unlike third-party platforms, Streamlit encourages limitless creativity, making it the ideal choice for empowering the next generation of innovators.
As you continue to explore these capabilities, take note on the impact of these creations can have—not just in the classroom but also in the communities and beyond. Through dashboard development, you’re not just learning coding; but also learning to turn ideas into impactful realities.


Submission Requirement
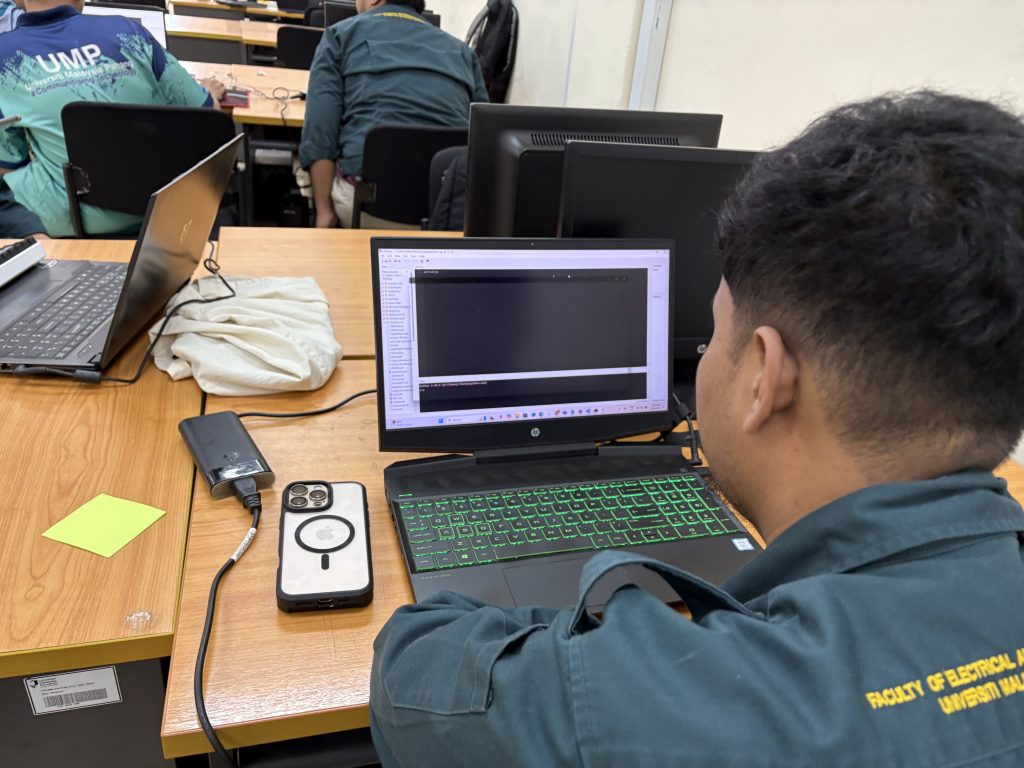
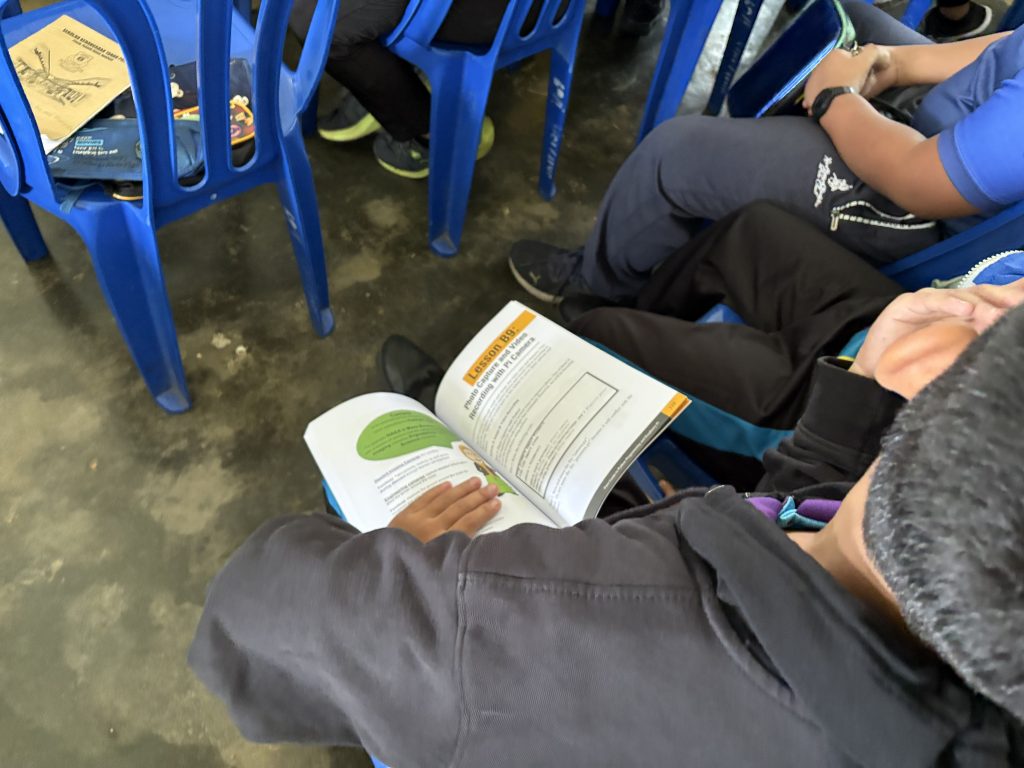
Today’s class focused on integrating a camera module with the Raspberry Pi, providing students hands-on experience in capturing images, recording videos, and setting up real-time video streaming. This session was a step forward in understanding how Raspberry Pi can be used for imaging and streaming applications, which is essential for more advanced projects like surveillance systems and AI-based object detection.