The best part of doing design is when you can turn all the useful information into graphics.
When we summarize the data into a colorful graphic design to ease our reader.
By doing info graphics, we certainly increase the understanding of our readers. And so far, I’m enjoying doing info graphic than designing any graphics related work.
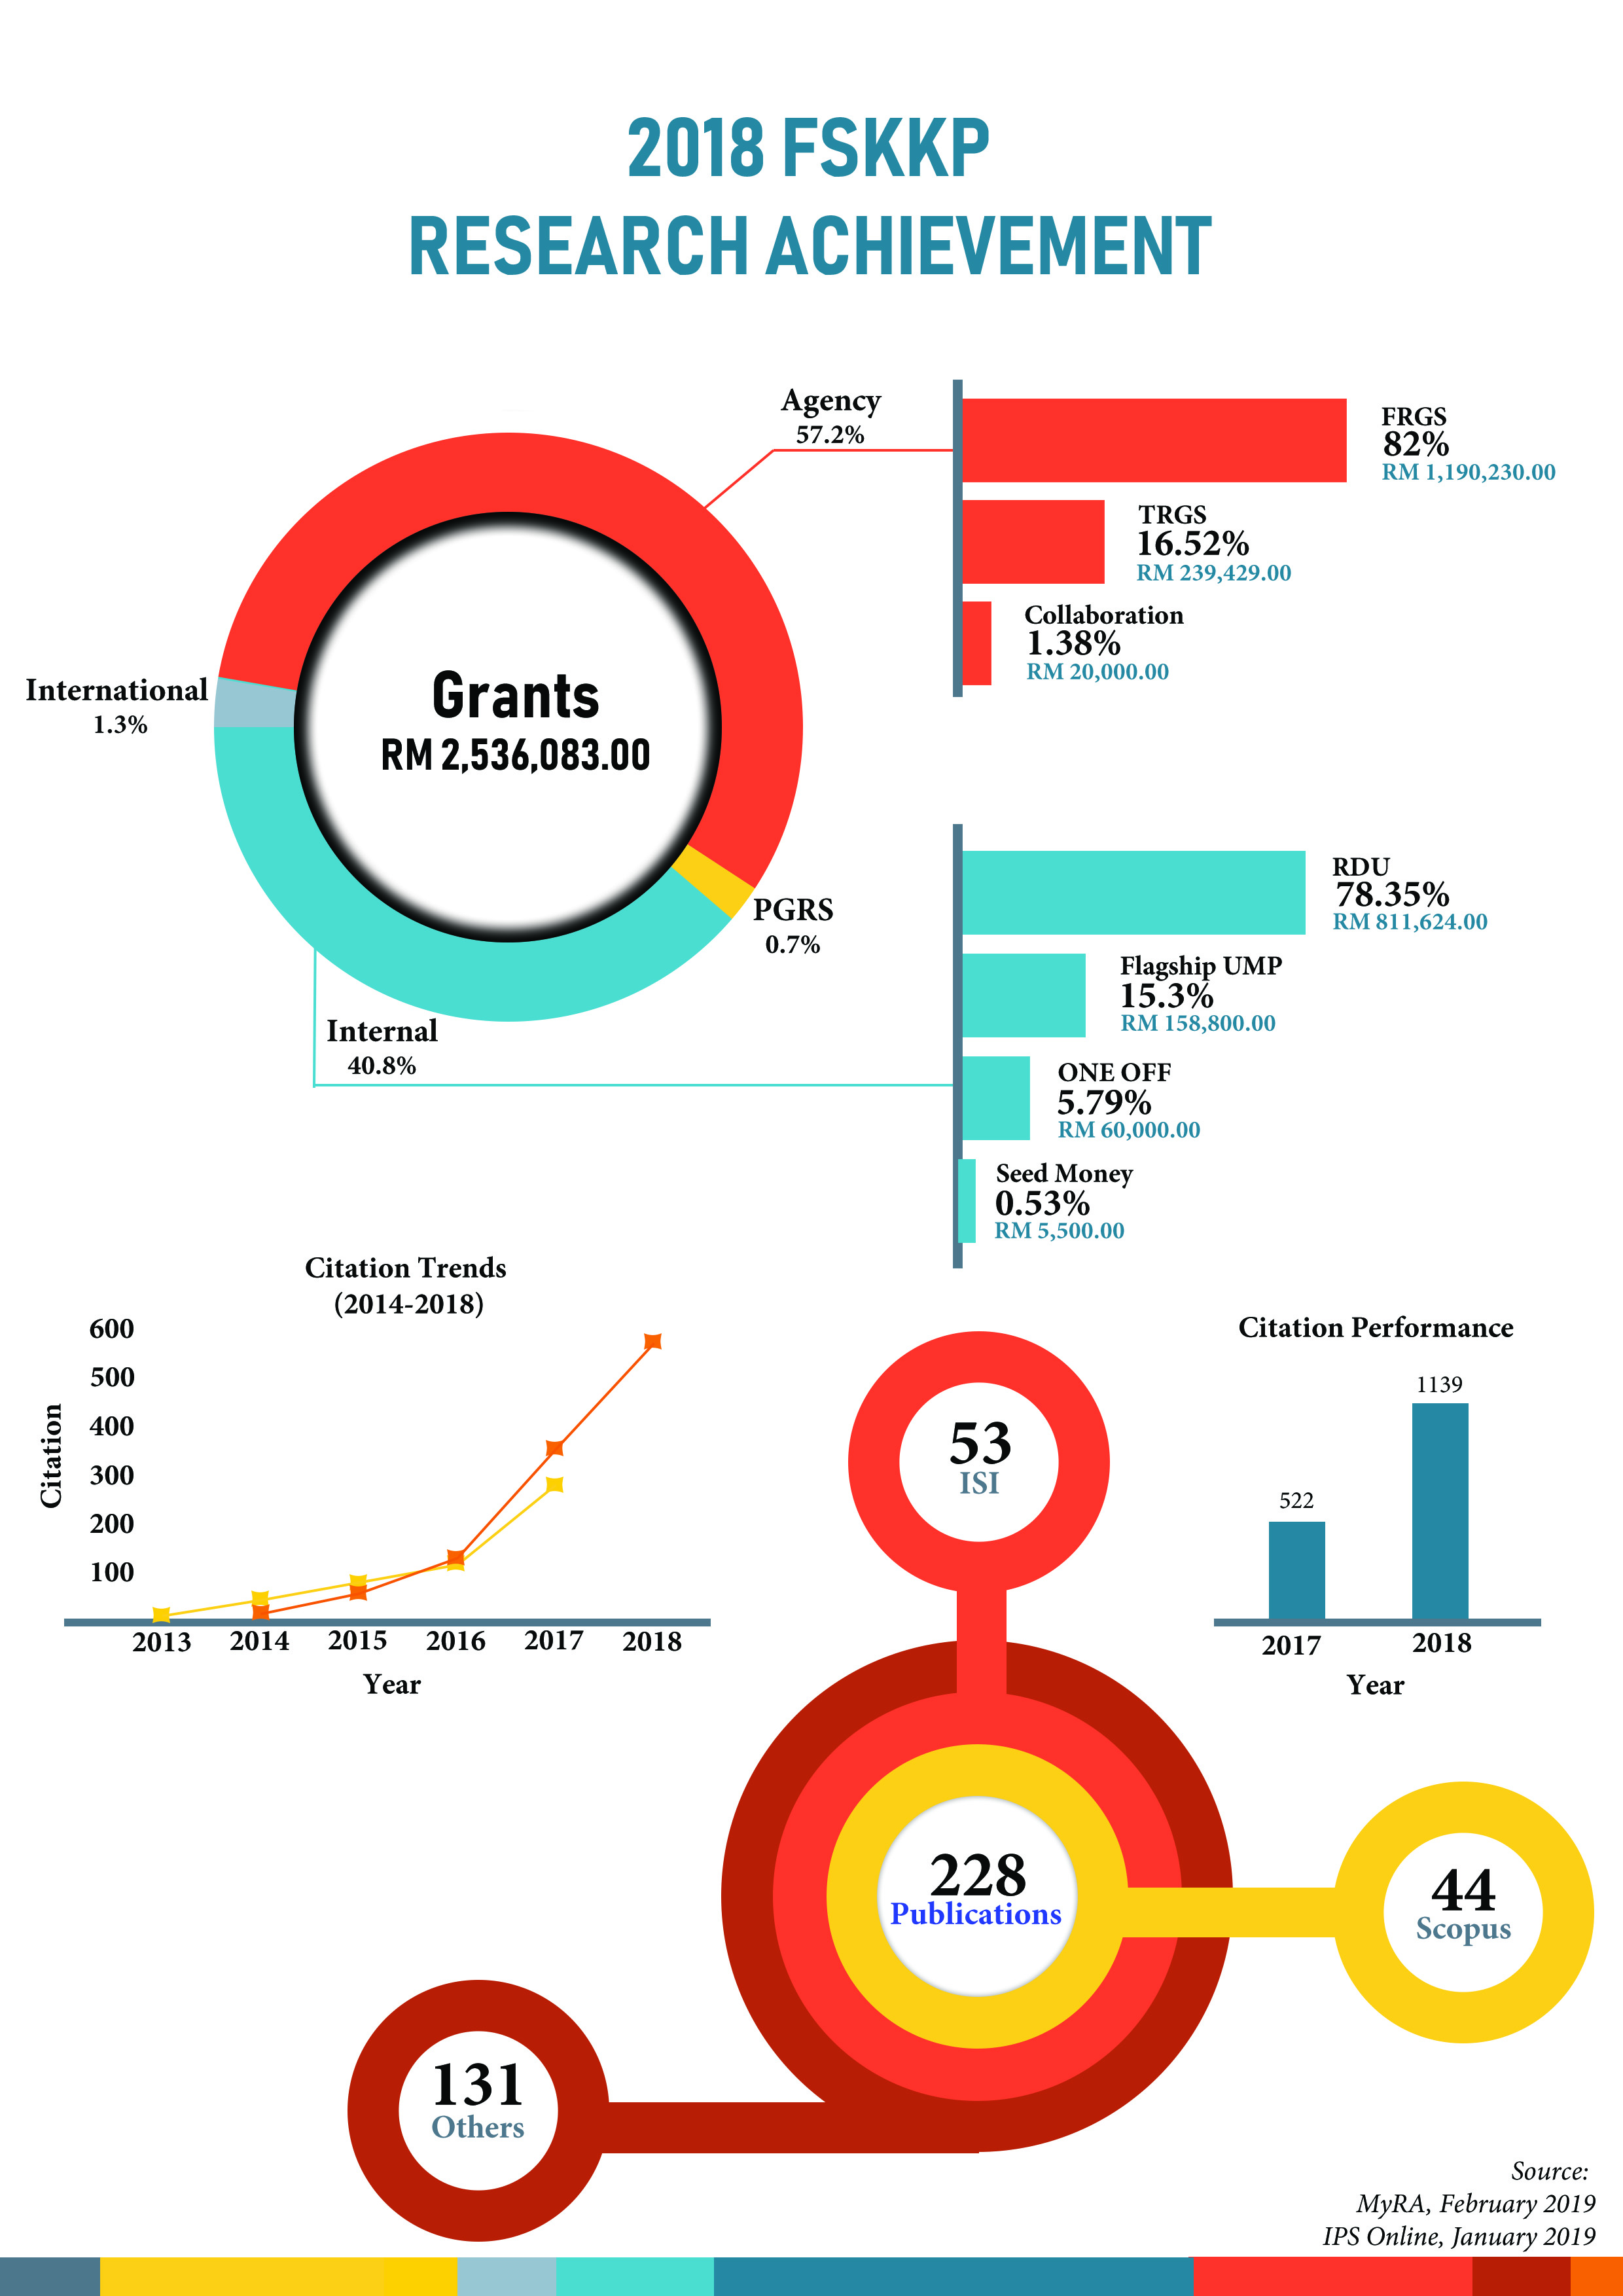
I did this infographic as part of our bit@FSKKP content.
Do grab and read our faculty bulletin! HERE
Until then…
Leave a Reply